


the health strategy – research, journal & advisory
institute, portal & consulting
for workforce health & economic prosperity
Joaquim Cardoso MSc.
Servant Leader, Chief Research & Strategy Officer (CRSO),
Editor in Chief and Senior Advisor
January 20, 2024
Cite this article as:
Newman-Toker DE, Nassery N, Schaffer AC, et al Burden of serious harms from diagnostic error in the USA; BMJ Quality & Safety 2024;33:109–120.
Background
Diagnostic errors cause substantial preventable harms worldwide, but rigorous estimates for total burden are lacking.
We previously estimated diagnostic error and serious harm rates for key dangerous diseases in major disease categories and validated plausible ranges using clinical experts.
Objective
We sought to estimate the annual US burden of serious misdiagnosis-related harms (permanent morbidity, mortality) by combining prior results with rigorous estimates of disease incidence.
Methods
Cross-sectional analysis of US-based nationally representative observational data. We estimated annual incident vascular events and infections from 21.5 million (M) sampled US hospital discharges (2012–2014). Annual new cancers were taken from US-based registries (2014).
Years were selected for coding consistency with prior literature. Disease-specific incidences for 15 major vascular events, infections and cancers (‘Big Three’ categories) were multiplied by literature-based rates to derive diagnostic errors and serious harms.
We calculated uncertainty estimates using Monte Carlo simulations. Validity checks included sensitivity analyses and comparison with prior published estimates.
Results
- Annual US incidence was 6.0 M vascular events, 6.2 M infections and 1.5 M cancers.
- Per ‘Big Three’ dangerous disease case, weighted mean error and serious harm rates were 11.1% and 4.4%, respectively.
- Extrapolating to all diseases (including non-’Big Three’ dangerous disease categories), we estimated total serious harms annually in the USA to be 795 000 (plausible range 598 000–1 023 000).
- Sensitivity analyses using more conservative assumptions estimated 549 000 serious harms.
- Results were compatible with setting-specific serious harm estimates from inpatient, emergency department and ambulatory care.
- The 15 dangerous diseases accounted for 50.7% of total serious harms and the top 5 (stroke, sepsis, pneumonia, venous thromboembolism and lung cancer) accounted for 38.7%.
Conclusion
An estimated 795 000 Americans become permanently disabled or die annually across care settings because dangerous diseases are misdiagnosed.
Just 15 diseases account for about half of all serious harms, so the problem may be more tractable than previously imagined.
Infographic
WHAT IS ALREADY KNOWN ON THIS TOPIC
- Diagnostic errors are known to be common, costly and often catastrophic in their health outcomes for patients.
- Nevertheless, current estimates of the aggregate burden of serious harms resulting from medical misdiagnosis vary widely.
WHAT THIS STUDY ADDS
- This study provides the first national estimate of permanent morbidity and mortality resulting from diagnostic errors across all clinical settings, including both hospital-based and clinic-based care (0.6–1.0 million each year in the USA alone).
- It does so via an approach that extrapolates from disease-based estimates for the most common dangerous conditions that often cause serious harms when missed-vascular events, infections and cancers.


Introduction
Diagnostic error is a major source of preventable harms worldwide across clinical settings,1–6 but epidemiologically valid estimates of overall misdiagnosis-related morbidity and mortality are lacking. The US National Academy of Medicine describes improving diagnosis in healthcare as a ‘moral, professional, and public health imperative’.7 In its 2015 report, the National Academy concluded that ‘most people will experience at least one diagnostic error in their lifetime, sometimes with devastating consequences’. However, the report also noted that, ‘the available research estimates [are] not adequate to extrapolate a specific estimate or range of the incidence of diagnostic errors in clinical practice today’.7 This concern is reflected in the wide variation of US estimates for total annual diagnostic errors (12 million (M) to >100 M) and serious misdiagnosis-related harms (40 000 to 4 M).8 No studies have yet used nationally representative datasets to measure aggregate US diagnostic errors or harms.
Given wide variation in prior estimates of total diagnostic errors and harms,8 9 we pursued a novel disease-based approach to constructing a national estimate that would span ambulatory clinic, emergency department and inpatient care. The disease-based approach leveraged three major disease categories — vascular events, infections and cancers (the ‘Big Three’) — found in both malpractice claims and clinical studies of diagnostic error to account for three-quarters of serious harms.9 To estimate the total US burden of medical misdiagnosis, we multiplied national estimates of disease incidence (including those initially misdiagnosed) by the disease-specific proportion of patients with that disease experiencing errors and harms. We did this for 15 key diseases causing the most harms, then extrapolated to the grand total across all diseases. To assess the robustness of our final estimates, we used sensitivity analyses to measure the impact of methodological choices and tested validity via comparison to prior literature and expert review.
Methods
This was a three-part research study in which the first two published components8 9 form the basis of the current analysis, which represents the third and final component (online supplemental file 1-A1). The main goal of this three-phase research project was to estimate the total number of serious misdiagnosis-related harms (ie, permanent disability or death) occurring annually in the USA across all care settings (ambulatory clinic, emergency department and inpatient). As reported previously,8 9 each study phase was designed to answer a key question from a specific data source that would support the final estimate: (1) what dangerous diseases account for the majority of serious misdiagnosis-related harms? (using 10 years of data from a large, nationwide malpractice database representing ~30% of all US claims, then comparing the proportion of ‘Big Three’ diseases with that from clinical practice-based (non-claims) studies9; (2) how common are diagnostic errors potentially causing harm among these dangerous diseases? (using estimates of error and harm rates from high-quality clinical studies,3 8 further validated by experts) and, for this final component, (3) what is the overall epidemiological incidence of diagnostic errors and harms among these dangerous diseases? (using nationally representative databases to measure dangerous disease incidence and multiply these by error and harm rates). This final analysis also extrapolates to all (including non-‘Big Three’) diagnostic errors and serious misdiagnosis-related harms by using the previously reported9 attributable fraction of ‘Big Three’ diseases in clinical practice. We constructed our scientific approach such that the final grand total estimates for errors and harms in the USA are based on clinical literature and US population incidence, not malpractice claims. This is because (a) no error or harm rates were taken from claims-based studies, (b) the extrapolation from ‘Big Three’ disease estimates to the grand total were based on the proportion of ‘Big Three’ diseases causing errors and harms from clinical studies (described in ‘Outcome measures’ section) and © any impact of having used malpractice claims to construct the original disease list or weights are mathematically unrelated to the grand totals (online supplemental file 1-A2). We summarise key aspects of prior study methods8 9 as needed for readers to follow this final component.
Diagnostic error, misdiagnosis-related harm and harm severity definitions
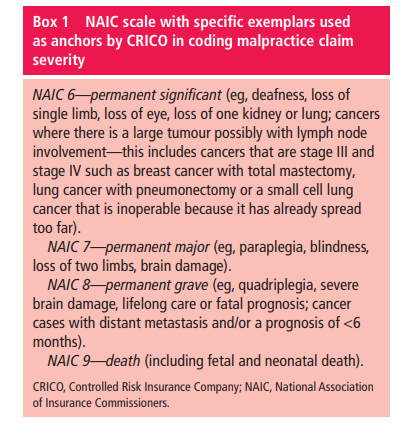
As reported previously, 8 9 we used published definitions for diagnostic error 7 and misdiagnosis-related harms. 10 In this study, we considered only false negative diagnoses (ie, initially missed or delayed) and associated harms. 3 8 Harms from inappropriate use or overuse of diagnostic tests, 11 12 or from overdiagnosis (ie, overtreatment of correctly diagnosed conditions that, left undiagnosed, would be unlikely to impact patient health) 10 13 were not considered. Harm severity was categorised according to a recognised insurance industry standard for measuring severity of injury in malpractice claims. 14 15 Serious (high-severity) misdiagnosis-related harms were defined as scale scores 6–9 representing serious permanent morbidity or mortality ( box 1). 9
Although technically proportions, we use the more common terminology ‘rates’ to describe diagnostic errors and misdiagnosis-related harms for ease of readability. The diagnostic error rate is the proportion of patients with a target disease who were not diagnosed in accurate and timely fashion; the misdiagnosis-related harm rate is the proportion of patients with a target disease who were not diagnosed in accurate and timely fashion and suffered serious harms from the target disease.
Current study design and data sources
This cross-sectional study multiplied literature-based estimates of diagnostic errors and harms (reported previously by our team 3 8) by nationally representative epidemiological data on disease incidence (reported here for the first time) to estimate total misdiagnosis-related harms. Multiplying disease incidence by the disease-specific proportion of patients experiencing errors and harms will result in total estimates across care settings (ambulatory clinics, emergency department and inpatient). False negative diagnostic error and harm rates for 15 key diseases ((1) stroke, (2) venous thromboembolism, (3) arterial thromboembolism, (4) aortic aneurysm/dissection, (5) myocardial infarction, (6) sepsis, (7) pneumonia, (8) meningitis/encephalitis, (9) spinal abscess, (10) endocarditis, (11) lung cancer, (12) breast cancer, (13) colorectal cancer, (14) melanoma, (15) prostate cancer) were summarised from clinical studies and vetted by experts. 8 Our team published a follow-on systematic review 3 updating error rates for vascular events and infections. For the present study, we used updated rates only for diseases for which we found high-quality studies that could be subjected to formal meta-analysis 3 (diseases #1, 2, 4, 5, 6). For updated rates, we reapproached relevant experts if revised rates had >1% absolute difference and the previous point estimate fell outside the new estimate’s CI. Only stroke met these criteria; we reapproached two emergency physicians and two stroke neurologists to assess the face validity of the revised rates. As reported previously, for unnamed ‘other’ diseases within each ‘Big Three’ category (ie, where it was not possible to find literature-derived rates), we substituted the average rate for that category. 8 To ensure that estimates in this final national analysis were optimised and comparable, we repeated the same statistical procedures as before 8 but using the revised error rates.
We derived population-based data on disease incidence from public use datasets employing nationally representative sampling or census methods. This represents the number at risk for diagnostic error across all clinical settings. All age groups were included. The annual incidence of specific conditions within the ‘Big Three’ disease categories (ie, vascular events, infections and cancers) was measured using discharge data from two sources: (1) the National Inpatient Sample (NIS) (2012–2014), Healthcare Cost and Utilisation Project (HCUP), Agency for Healthcare Research and Quality 16 and (2) North American Association of Central Cancer Registries (NAACCR) 17 curated by the American Cancer Society (ACS) (2014). 18 The year 2014 was chosen as the last full year in which national data were coded using the International Classification of Diseases 9th revision, Clinical Modification (ICD-9-CM), prior to the 2015 transition to the International Classification of Diseases 10th revision, Clinical Modification, for coding consistency with the previously published components of the study. 8 9
Disease incidence data for vascular events and infections
The conservative assumption was made that incident cases of dangerous (life or limb-threatening) vascular events and infections in the USA would eventually involve a hospitalisation, even if the patient was initially misdiagnosed in an ambulatory care setting. Outpatient (eg, primary care, emergency department) visit diagnoses were not included separately in the disease incidence calculations because they would risk inflating disease incidence estimates through double counting. For example, if ‘myocardial infarction’ cases that were correctly diagnosed in outpatient care (and then later confirmed as an inpatient) had been included in the analysis, the same incident cases would be counted twice. Out-of-hospital deaths from these conditions were not considered, as cause-of-death listings on death certificates are known to be inaccurate for some conditions (eg, myocardial infarction). 19
HCUP NIS data were used to measure US inpatient hospital stays, counting discharge or in-hospital death diagnoses coded in either the principal or first-listed secondary diagnosis positions, as these diagnoses are often of equal, competing weight. 20 We chose this approach for the primary analysis because (1) using second-position codes can increase sensitivity without sacrificing specificity 21 and (2) ‘secondary’ diseases are also incident disease cases with the potential to be misdiagnosed, independent from the ‘primary’ disease (eg, a comorbid stroke in a patient with endocarditis might also be missed and this additional missed opportunity could also harm the patient).
Disease-level and ‘Big Three’ category-level code groupings were the same as those used in prior project phases 8 9 and double-checked for coherence with NIS analysis ( online supplemental file 1-A3). These were derived from HCUP’s Clinical Classification Software, which groups ICD-9-CM codes into clinically meaningful categories. We used NIS data (2012–2014) to estimate the annual number of hospital discharges nationwide by disease and category. A 3-year average was chosen to improve stability of incidence measures for rare conditions (eg, spinal abscess). We followed standard procedures for NIS data to derive nationally representative estimates ( online supplemental file 1-A4). 22
Disease incidence data for cancers
Inpatient hospital stays would not be a good proxy for incident cancer cases, since cancers are treated in outpatient settings and patients are usually only hospitalised for complications. Instead, national incidence counts by cancer site (ie, body location) were obtained from the 2014 ACS report. 18 As stated in the report, counts were based primarily on incidence data collected by the NAACCR, which represents 89% of the US population. ACS also used other unidentified sources to generate their final counts, but, because both NAACCR and ACS treat these registry-based estimates as a census (ie, no sampling-related uncertainty), we did the same. Some ACS categories were grouped to match the prior disease classification from earlier study phases (eg, colon and rectum cancer grouped as ‘colorectal’). 8 9
Outcome measures
The main outcome measures were estimates of total annual diagnostic errors (false negatives) and serious misdiagnosis-related harms (permanent morbidity or mortality) in the USA for 2014, across all clinical settings. Outcomes were calculated for the ‘Big Three’ disease categories, including 15 specific diseases (ie, the previously identified 9 top five vascular events, infections and cancers), ‘other’ (non-top five) diseases within each category and corresponding category totals.
In turn, these ‘Big Three’ results were used to calculate a grand total (including non-’Big Three’ dangerous diseases) using the clinical proportion of diagnostic errors (58.5%) and serious harms (75.8%) attributable to ‘Big Three’ diseases. 9 These proportions derive exclusively from research studies based in clinical practice (ie, not malpractice claims studies) ( see prior citation,9 p. 237). Mathematically, the grand total of diagnostic errors was calculated by dividing the ‘Big Three’ total number of diagnostic errors by 0.585. Similarly, the grand total of serious misdiagnosis-related harms was calculated by dividing the ‘Big Three’ total number of serious misdiagnosis-related harms by 0.758.
Using the proportion of deaths among serious harms across clinical settings (~46.7%), 6 23 we estimated total deaths (total serious harms × proportion of deaths among serious harms=total deaths). By subtraction, we estimated total disabilities (total serious harms-total deaths=total disabilities).
Statistical analysis and reporting
We used sample sizes, totals, means, medians, 95% CIs, IQRs and PPRs to describe populations and outcomes, as appropriate. NIS analysis was conducted using the PROC SURVEYMEANS procedure in SAS V.9.3 (Cary, North Carolina, USA). All other statistical calculations were performed using R V.4.2.2 (Vienna, Austria). This manuscript follows Enhancing the QUAlity and Transparency Of Health Research (Strengthening the Reporting of Observational Studies in Epidemiology) 25 reporting guidelines for observational studies.
Role of the funding source
The funders had no role in study design, data collection and analysis, decision to publish or preparation of the manuscript.
Quality of data sources for error and harm rates
Error and harm rates were published previously. 3 8 For 14 of 15 diseases (besides arterial thromboembolism, where we aggregated four retrospective case series), condition-specific diagnostic error rates were derived from high-quality clinical literature. This included clinical studies with strong designs (large prospective clinical trials or studies using population-based sampling or registries) or meta-analyses of high-quality clinical studies. For condition-specific diagnostic error rates, there were 47 source studies (vascular events (n=28), infections (n=10), cancers (n=9)) representing 942 916 patients (median study sample n=397 (IQR 176–1914); median per-disease sample n=2343 (IQR 398–10 351)). For disease-agnostic harm rates, there were five source studies representing 1216 diagnostic errors and 374 serious harms. Each study operationalised definitions slightly differently (eg, nature of diagnostic reference standard), but all definitions for errors/harms were consistent with published definitions described in the ‘Methods’ section.
US population-based incidence of vascular events, infections, and cancers
The total NIS sample from 2012 to 2014 included 21.5 M hospitalisations (for all conditions, not just vascular events or infections), representing a weighted national estimate of 107.4 M total discharges (mean annual 35.8 M). In 2014, the sample was taken from 4411 different hospitals across 45 states (representing ~80% of hospitals and 90% of states in the USA). The mean weighted annual number of incident vascular events was 6.0 M (95% CI 5.9 to 6.0). Patients had a median age of 67.5 years (IQR 57.2–78.2, range 0–90); 44.8% were female and 70.0% were non-Hispanic white. The mean weighted annual number of incident infections was 6.2 M (95% CI 6.1 to 6.3). Patients had a median age of 63.7 years (IQR 52.8–79.8, range 0–90); 51.3% were female and 68.6% were non-Hispanic white. The number of incident cancer cases in 2014 was 1.5 M. Patients had a median age of just over 65 years (<20, 0.9%; 20–49, 11.8%; 50–64, 33.2%; 65–74, 28.5%; ≥75, 250.7%); 50.7% were female and 80.0% were non-Hispanic white. The estimated total annual incidence of all ‘Big Three’ diseases was 13.7 M (43.5% vascular events, 45.2% infections, 11.3% cancers) ( table 1).
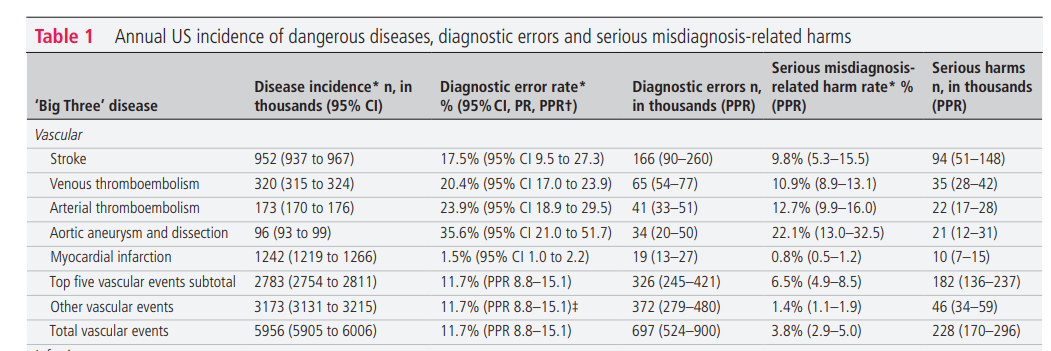
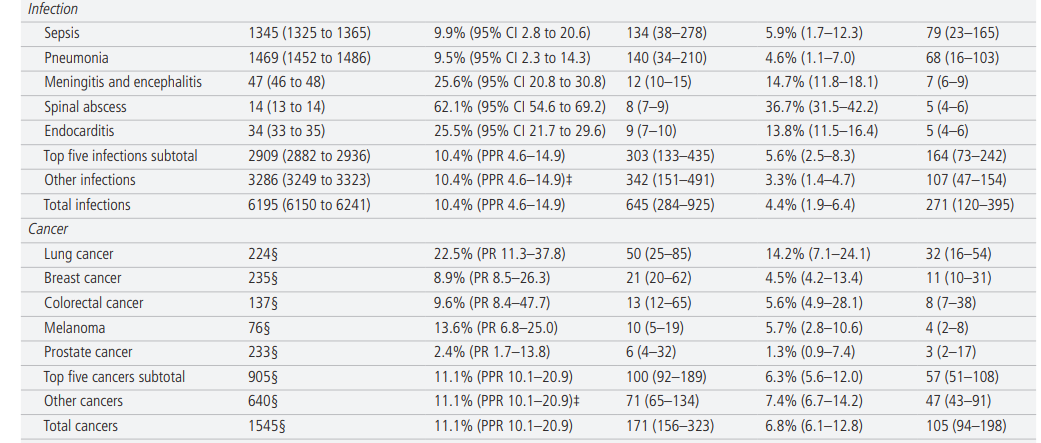
Overall incidence of diagnostic errors and serious harms
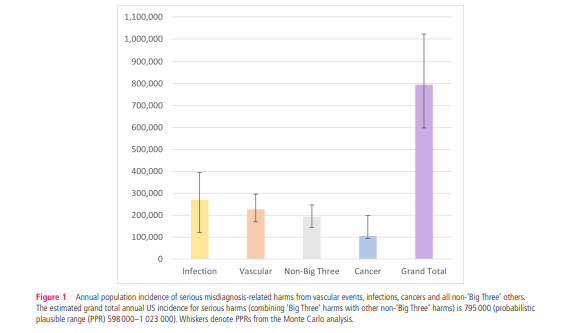
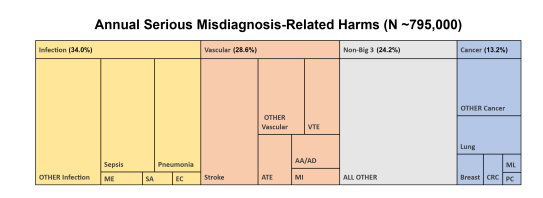
Table 1 shows annual estimated disease incidence, diagnostic errors, and serious misdiagnosis related harms by disease and by category (and denotes whether uncertainty for each parameter is represented by CI, PR, or PPR). Serious misdiagnosis-related harms are summarized in Figures 1 and 2. Across the ‘Big Three’ categories, there were 1.51M (PPR 1.12–1.89) missed diagnoses and 603,000 (PPR 454,000–776,000) serious harms; mean diagnostic error and serious harm rates per true disease case for any ‘Big Three’ disease (including ‘other’ subcategories) were 11.1% and 4.4%, respectively. The 15 individually analyzed ‘Big Three’ diseases together accounted for 403,000 serious harms (50.7% of the grand total); mean diagnostic error and serious harm rates per true disease case for the 15 specific diseases (excluding ‘other’ subcategories of the ‘Big Three’) were 11.1% and 6.1%, respectively. Among these, five conditions linked to the largest numbers of serious harms (stroke, sepsis, pneumonia, venous thromboembolism, and lung cancer) together accounted for 308,000 serious harms (38.7% of the grand total). Across all dangerous diseases (including non ‘Big Three’), the grand total estimate was 2.59M (PPR 1.92–3.23) missed diagnoses and 795,000 (PPR 598,000–1,023,000) serious harms (broken down as 371,000 total deaths and 424,000 total disabilities).
Sensitivity analyses and validity checks
The population-level serious harm totals were most sensitive to harm rates for the highest-incidence infections (‘other’ infections, sepsis, pneumonia) and stroke, but even if each of these harm rates were placed at the lower plausible bound of harms for that specific disease, the grand total of serious harms across all diseases would still be over 500 000 ( online supplemental file 1-B1). Using only principal diagnosis NIS codes, which assumes a lower disease incidence and reduces any residual risks of double counting, gave lower estimates by about 30% (grand totals 1.78 M missed diagnoses and 549 000 serious harms ( online supplemental file 1-B2)). The impact of methodological assumptions on undercounting ( online supplemental file 1-B3) and overcounting ( online supplemental file 1-B4) were both estimated at <8% and likely offsetting.
Validity checks assessed current results based on similarity to (or coherence with) values derived independently using setting-specific (eg, hospital-based) medical literature. Estimated misdiagnosis-attributable death rates were 14.1% (n=~371 000 of 2.6 M US deaths in 2014) for the primary analysis and 9.8% (n=~256 000 of 2.6 M US deaths in 2014) for the principal-only analysis ( online supplemental file 1-C1). By comparison, the literature-derived rate of misdiagnosis-attributable deaths based on hospital autopsies (8.4%, 95% CI 5.2 to 13.1) and inpatient diagnostic adverse events (~7.4%) were lower, as expected ( online supplemental file 1-C1,C2). Our disease-based estimate of total serious misdiagnosis-related harms (across clinical settings) of ~795 000 (PPR 598 000–1 023 000) was comparable to independent literature-derived values using a setting-based (rather than disease-based) approach, which assessed ~855 000 (490 000–1 659 000) serious misdiagnosis-related harms ( online supplemental file 1-C3). Estimates of inpatient misdiagnosis-related deaths derived from our disease-based approach (~105 000) fall within the uncertainty bounds of those derived independently from previously published medical literature on hospital autopsies (~82 000 (51 000–128 000)) and hospital-based adverse events (~72 000 (51 000–113 000)) ( online supplemental file 1-C3). Per-visit serious harm rates by either method were estimated at 0.08% ( online supplemental file 1-C3). After iterative review and feedback (described previously), 8 final estimates for disease-specific incidence, error/harm rates and total serious harms were deemed face valid by 24 clinical domain experts.
Patient consent for publication
Not applicable.
Ethics approval
No human subjects participated in this study, and no institutional review board approval was needed.
Originally published at https://qualitysafety.bmj.com on February 1, 2024.
Authors