The Lancet — Regional Health, Asia Pacific
Ann Kwee, Zhen Ling Teo, and Daniel Shu Wei Ting
May 08, 2022
Executive Summary by
Joaquim Cardoso MSc.
Health Transformation Institute
Digital Health Unit
July 4, 2022 (techtarget)
Digital technology and virtual health have sparked tremendous interest in healthcare, especially during the COVID-19 pandemic.
With the advent of digital health technologies, there are questions about whether these interventions are truly more efficient.
Broadly speaking, health economic outcomes can be assessed in several ways:
- cost-effectiveness analysis;
- cost-utility analysis;
- cost-minimization analysis and
- cost-benefit analysis.
To evaluate the health economic analysis of the emerging digital health technologies or strategies, the following steps could be taken into consideration.
- First, define the intended use environment and disease burden/prevalence.
- Second, choose the appropriate health economic model based on the intended use.
- Third, evaluate the diagnostic performance of the mode of screening with reference to the standard of care.
- Fourth, evaluate direct and indirect costs for screening technologies, clinical services, hospital systems and digital infrastructure.
The COVID-19 pandemic has expedited the digital transformation of the healthcare systems globally, and these opportunities could potentially reshape and revolutionize how we practice medicine in the coming decades.
ORIGINAL PUBLICATION (full version)
Digital technology and virtual health have sparked tremendous interest in healthcare, especially during the COVID-19 pandemic. 1
Globally, 250 million people are visually impaired, among whom 36 million are blind. 2
The economy and development of a sustainable workforce may be affected by the prevalence of visual impairment in society.
Diabetic retinopathy (DR) and age-related macular degeneration (AMD) are common acquired causes of visual loss amongst the working adult and elderly population. 3
DR, a microvascular complication of diabetes, affects approximately 103 million adults worldwide. 4
With the advent of digital health technologies, there are questions about whether these interventions are truly more efficient.
Cost-effective analysis helps to identify a price below which a particular intervention represents good value for money. 5
Broadly speaking, health economic outcomes can be assessed in several ways (Table 1) —
(1) cost-effectiveness analysis;
(2) cost-utility analysis;
(3) cost-minimization analysis and
4) cost-benefit analysis. 6
Table 1 — Summary of health economic analyses.
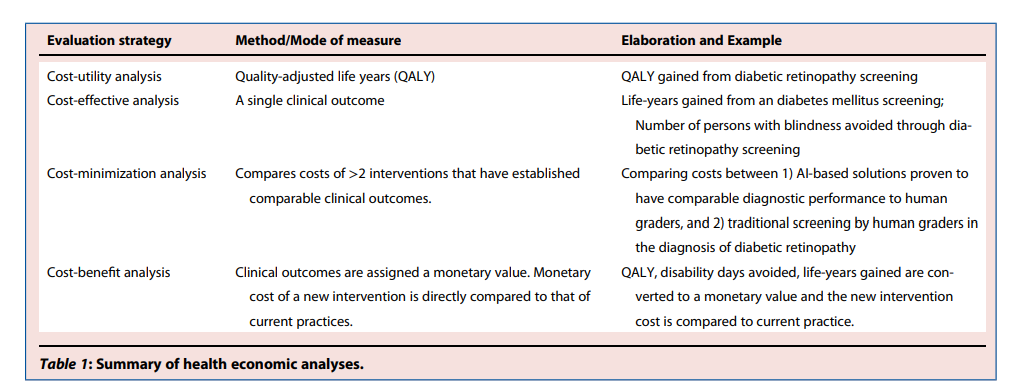
For cost-effectiveness analysis, the outcome measure is usually life-years gained and incremental cost-effectiveness ratio (ICER); whereas for cost-utility analysis, it is quality-adjusted life-years (QALYs).
ICERs should be compared with a willingness-to-pay threshold for value determinations. 5
In a cost-minimization analysis, two technologies have comparable clinical outcomes.
Lastly, cost-benefit analysis converts clinical outcomes and effects such as life-years gained, QALYs gained, avoided disability days or medical complications into monetary value.
However, it is challenging to tag a monetary value to a specific clinical outcome. To complicate the matter further, utility weights derived using different methods or instruments are not necessarily comparable. 5
Evaluation strategyMethod/Mode of measureElaboration and ExampleCost-utility analysisQuality-adjusted life years (QALY)QALY gained from diabetic retinopathy screeningCost-effective analysisA single clinical outcomeLife-years gained from an diabetes mellitus screening; Number of persons with blindness avoided through diabetic retinopathy screeningCost-minimization analysisCompares costs of >2 interventions that have established comparable clinical outcomes.
Comparing costs between 1) AI-based solutions proven to have comparable diagnostic performance to human graders, and 2) traditional screening by human graders in the diagnosis of diabetic retinopathyCost-benefit analysisClinical outcomes are assigned a monetary value.
Monetary cost of a new intervention is directly compared to that of current practices.QALY, disability days avoided, life-years gained are converted to a monetary value and the new intervention cost is compared to current practice.
To analyze health economics, the burden of disease in question should be assessed 5 by understanding the prevalence, morbidity and disability-adjusted life years (DALYs). 5
It is also crucial to identify the perspective from which one is quantifying cost and effectiveness. 5
This can come in the form of the government, an insurer, patients and/or society. 5
Private cost incurred by the patient may not be considered, if cost-effectiveness is considered from a health ministry budget point of view and therefore, alternative perspectives may be relevant in secondary analyses. 5
A secondary analysis using the societal perspective is recommended when there are likely to be considerable costs/benefits to patients and caregivers. 5
Specifically in screening for DR or AMD, it is important to consider the following factors into the calculations:
(1) human graders’ or technology (e.g., artificial intelligence [AI]) diagnostic performance;
(2) deployment mode: for human graders, whether it is 1-tiered, 2-tiered or 3-tiered grading starting from non-medical personnel to medical specialists; for AI technology, whether this is a fully autonomous, semi-autonomous or clinical decision support system;
(3) human graders or technology grading fees;
(4) digital infrastructure supporting the virtual platforms that can vary over time especially with regular system upgrades.
In detail, the screening diagnostic performance is important as the setting of the operating thresholds for sensitivity and specificity on the receivers’ operating curve will determine the corresponding false positive and false negative rates.
Each false positive will convert the screening population from primary to tertiary specialist’s care, resulting in a significant rise in healthcare costs.
The false negative, will result in medical morbidities and mortalities, impacting the financial capabilities of these patients suffering from the misdiagnosis.
The deployment mode will determine the degree of human graders or experts’ involvement.
Thus, the referrals thresholds between resource-rich versus resource-constraint settings must be carefully designed — disease specific and weighed against available treatment options.
The rules of threshold setting needs to be based on affordability, health priorities and impact on the budget. 5
In the recent issue of the Lancet Regional Health, Li et al. 7 evaluated the cost-effectiveness and cost-utility analysis on DR and AMD screening in China.
As a home to close to 1.5 billion population, the prevalence of diabetes and AMD was 12% 8 and 8.7% 9 respectively in China.
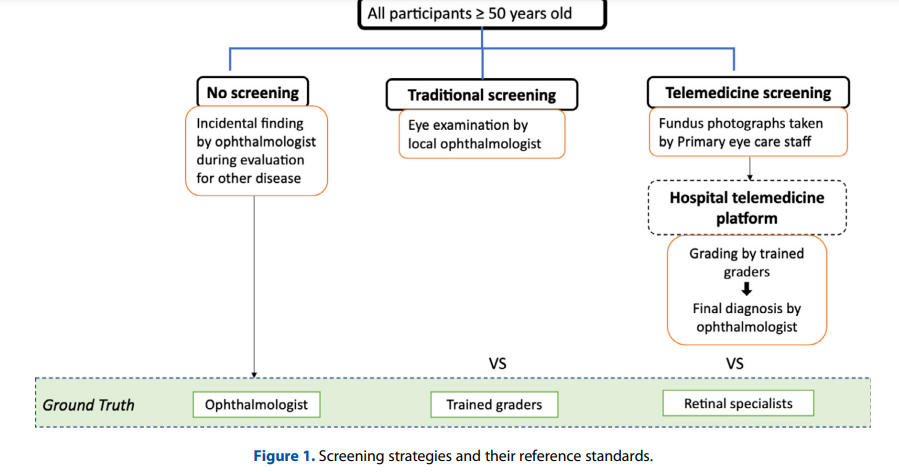
In this study, diabetic and non-diabetic participants > 50 years old were split into three groups over a 30 one-year Markov cycles:
(1) No screening program,
(2) Traditional community screening — examination by ophthalmologists or
(3) Telemedicine screening where fundus photographs were captured by primary eye care staff (e.g., nurses or medical assistants) and transmitted to a hospital telemedicine platform for assessment by trained graders and final adjudication by an ophthalmologist (Figure 1).
Figure 1 — Screening strategies and their reference standards.
In this study, the authors performed modelling based on several assumptions including prevalence of AMD and DR, compliance with screening and treatment, screening sensitivity and specificity that were derived from previous studies.
For referral thresholds, patients with any DR or any AMD were referred. For cost of screening, full examination and treatment costs were derived from the real-world clinical settings incurred by the Beijing Tongren Hospital and unified pricing by the Beijing Municipal Medical Insurance Bureau.
Li et al. 7 found that both traditional and telemedicine screening were effective in rural areas with incremental cost-utility ratios at $191 and $199 per 1 QALY gained respectively and ICER at $2436 and $2441 per year of blindness avoided respectively.
The cost-utility and cost-effectiveness was even higher in urban settings.
The authors also found the optimal screening interval to be annually averting 119 and 270 years of blindness in rural and urban areas per 100,000 people screened.
The paper has several key strengths.
First, this is one of the few papers that looks at a cost-effective analysis comparing traditional screening versus tele-screening.
Second, the study separated urban and rural groups and ran separate Markov models to minimize environmental influence.
This is especially important in diseases such as diabetes/DR where environmental factors play a significant role in disease progression and management.
In addition, actual cost metrics were used in the cost effectiveness analysis — using data from gross domestic product, Beijing Tongren Hospital, and the unified pricing of Beijing Municipal Medical insurance Bureau to account for both direct and indirect costs.
On the other hand, there are several areas that the authors could evaluate further in the future studies.
First, while Li et al. 7 demonstrated in this paper that tele-screening was the most cost-effective option for combined DR and AMD screening, it is important to evaluate the incremental benefit of having AMD screening in addition to DR screening.
As discussed by Li et al. 7 the cost effectiveness of AMD screening remains debatable especially in early AMD.
n South Korea and Hong Kong, opportunistic AMD screening was cost effective, but this is given the cost discounted from preexisting screening of other intended ocular diseases. 10 , 11
Thus, studying the incremental benefit of screening combined any DR and any AMD, verses any DR alone will be useful.
Furthermore, some countries (e.g., United Kingdom and Singapore) have utilized referral thresholds to selectively refer those with moderate non-proliferative DR or worse, or diabetic macular edema and these may further change the cost-effective analysis.
Second, while tele-screening by Li et al. 7 , is cost-effective, it still required trained graders and ophthalmologists which may not be available in resource poor settings.
In the past several years, fundus-based AI screening technologies using deep learning have become popular for DR and AMD, 12 , 13 , 14 with DR screening shown to be cost-effective. 15
The effectiveness of automated screening for DR and AMD in resource poor settings will require further evaluation.
Third, albeit using sound methodology, the study findings may not be generalizable to other countries due to the varying socio-economic factors, health resource allocation, prevalence of disease, manpower availability and costs. 15
It is also important to consider patient preferences that sometimes may differ from decision makers opinions. 5
In Summary:
In summary, to evaluate the health economic analysis of the emerging digital health technologies or strategies, the following steps could be taken into consideration. First, define the intended use environment and disease burden/prevalence. Second, choose the appropriate health economic model based on the intended use. Third, evaluate the diagnostic performance of the mode of screening with reference to the standard of care. Fourth, evaluate direct and indirect costs for screening technologies, clinical services, hospital systems and digital infrastructure. The COVID-19 pandemic has expedited the digital transformation of the healthcare systems globally, and these opportunities could potentially reshape and revolutionize how we practice medicine in the coming decades.
References and additional information
See the original publication
About the authors and affiliations
Ann Kwee,a
Zhen Ling Teo,b and
Daniel Shu Wei Ting b,c *
a Singapore General Hospital, Singapore
b Singapore National Eye Center, Singapore Eye Research Institute, Singapore
c Duke-NUS Medical School, National University of Singapore, Singapore
Originally published at https://www.thelancet.com


