the health strategist
institute for strategic health transformation
& digital technology
Joaquim Cardoso MSc.
Chief Research and Strategy Officer (CRSO),
Chief Editor and Senior Advisor
October 17, 2023
One page summary
What is the message?
The third quarter of 2023 witnessed a significant surge in announced hospital and health system transactions, with 18 deals, marking a notable increase from previous years.
However, the absence of mega mergers and the prevalence of financial distress as a transaction driver indicate a shift in the industry landscape.
Academic health systems are taking the lead in seeking community partnerships, and innovative, participatory structures are emerging as organizations navigate the evolving healthcare environment.

Key Takeaways
Transaction Activity Surges:
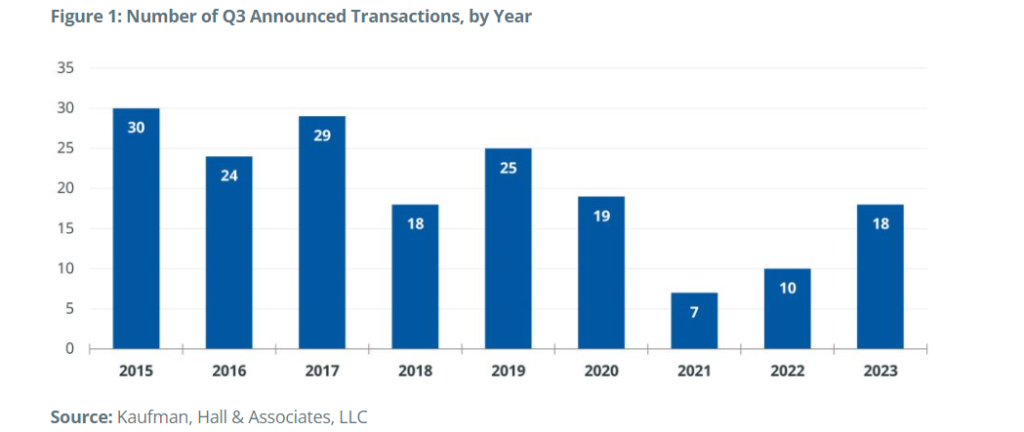
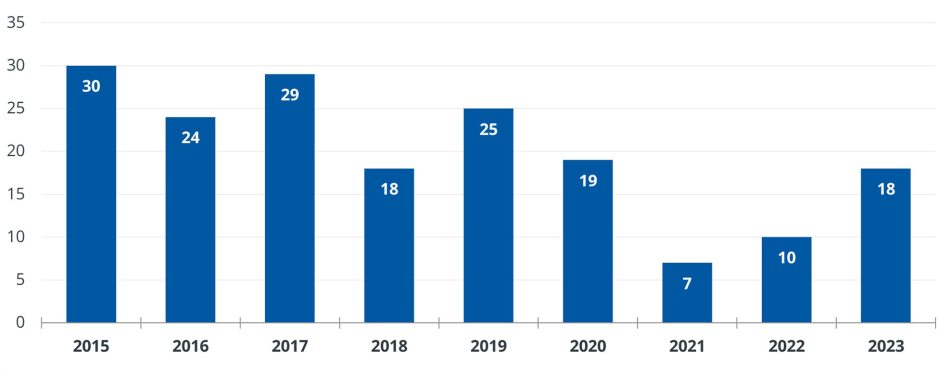
Q3 2023 witnessed an upsurge in announced transactions, with 18 deals. This figure far exceeded the seven transactions in Q3 2021 and the 10 in Q3 2022, emphasizing the industry’s return to pre-pandemic activity levels.
Lack of Mega Mergers:
Unlike previous quarters, only one mega merger was reported, impacting the average size of sellers and total transacted revenue. Nonetheless, overall transaction figures remain historically high.
Financial Distress as a Driver:
More than one-third of Q3 transactions were prompted by financial distress, reflecting the financial challenges faced by healthcare organizations. Operating margins, although improving, remain below the sustainability threshold.
Academic Health Systems on the Rise:
Not-for-profit health systems were the primary acquirers, with academic or university-affiliated systems making up half of these. Academic health systems are witnessing higher occupancy rates compared to acute-care hospitals and are looking to form community partnerships.
Innovative Partnership Structures:
Healthcare organizations are adopting creative structures to enhance access to care while maintaining independence. Examples include UVA Health’s acquisition of Riverside Health System and Novant Health’s minority stake in Conway Medical Center.
Mergers & Acquisitions (M&A):
- 18 transactions were announced in Q3 2023.
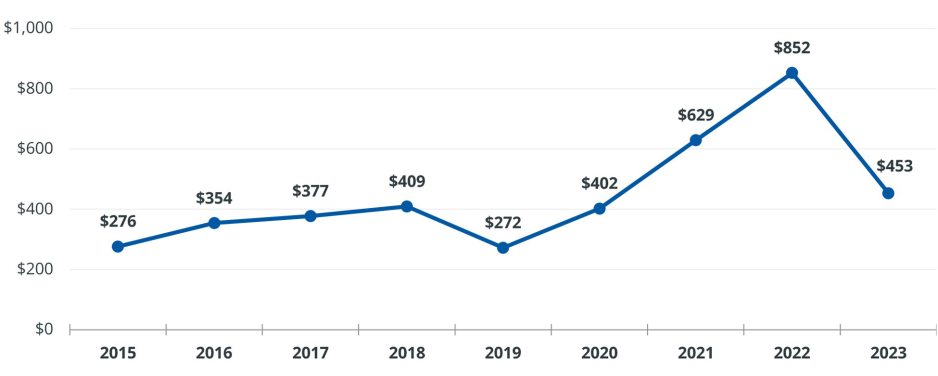
- Only one mega merger was reported, contributing to an average seller size of $453 million.
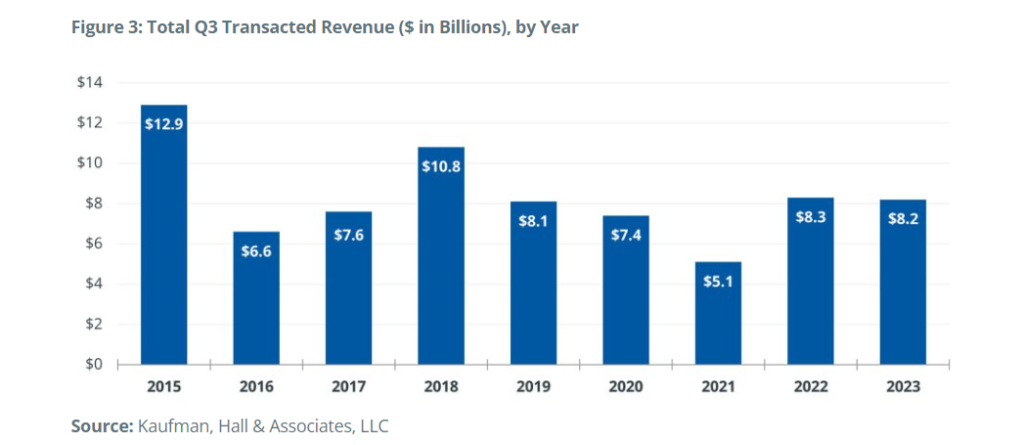
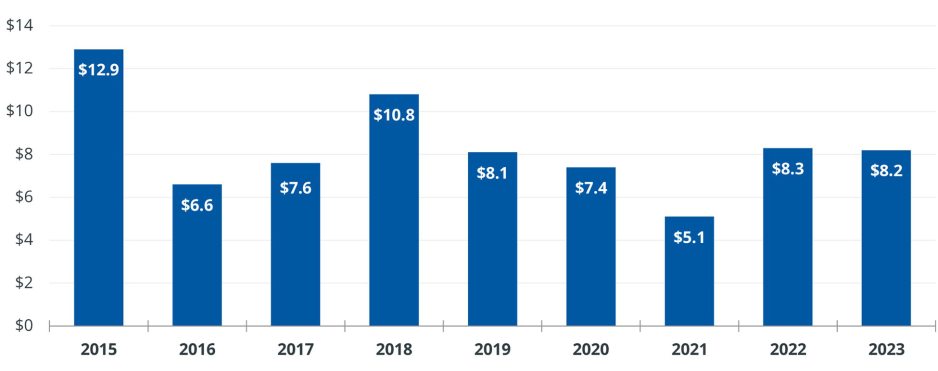
- Total transacted revenue was $8.2 billion, reflecting the absence of mega mergers in the quarter.
Profitability Margin:
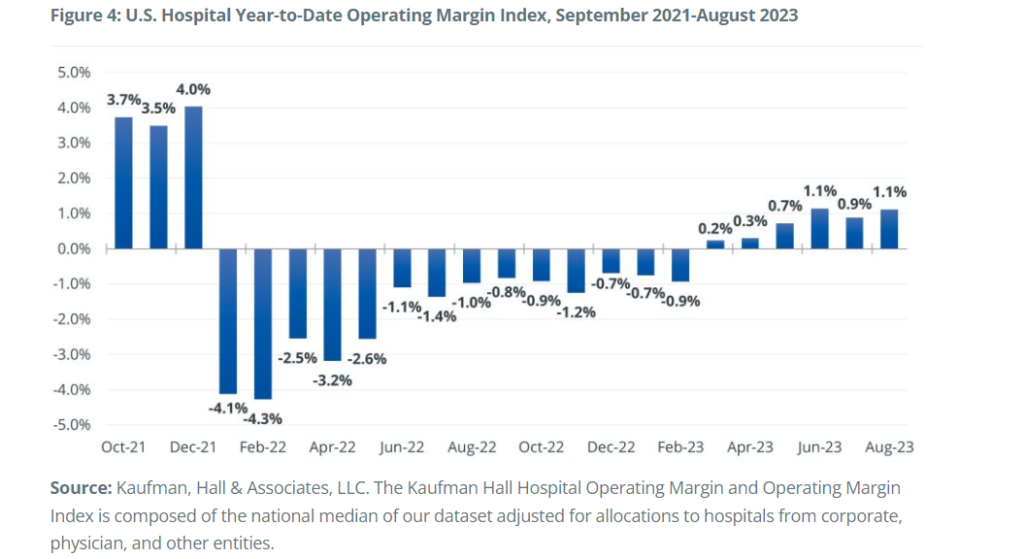
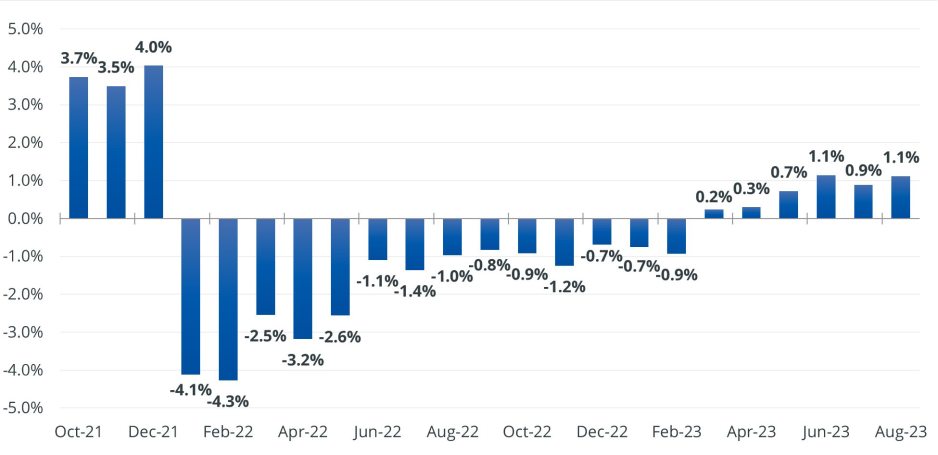
Median operating margins have improved in 2023 but remain slightly above 1%, falling short of the 3% threshold required for long-term financial sustainability.
Looking Forward:
While transaction activity is returning to pre-pandemic levels, increased regulatory scrutiny, including new proposed merger guidelines by the FTC and DOJ, will impact future deals. The lawsuit against U.S. Anesthesia Partners serves as an early test of these guidelines, with state attorneys general also gaining expanded authority to review transactions.
The healthcare industry faces evolving challenges and opportunities in the coming quarters, as organizations seek new alliances and partnerships in response to changing regulations and market dynamics.
Examples
- UVA Health’s acquisition of Riverside Health System, enhancing patient access and clinical trials.
- Novant Health’s acquisition of a minority stake in Conway Medical Center, addressing healthcare needs in South Carolina.
Statistics
- 39% of Q3 transactions cited financial distress as a key driver.
- 50% of not-for-profit acquirers in Q3 were academic or university-affiliated health systems.
- Academic health systems reported a median inpatient occupancy rate of 70%, compared to 53% for acute-care hospitals.
Infographic

DEEP DIVE
M&A Quarterly Activity Report: Q3 2023
Kaufman Hall
Anu Singh, Kris Blohm, Nora Kelly, Eb LeMaster, Courtney Midanek, Rob Gialessas, Chris Peltola
October 12, 2023

Hospital and Health System Transactions
Announced transaction activity remained high in Q3 2023, continuing this year’s trend of activity returning to pre-pandemic levels. Eighteen transactions were announced, well above the seven transactions announced in Q3 2021 and the 10 transactions announced in Q3 2022.
With only one “mega merger” transaction (a transaction in which the smaller party has annual revenues above $1 billion),[1] both average size of the seller (or smaller party) and total transacted revenue were below recent quarters, when a smaller number of total transactions and a higher percentage of mega mergers drove these metrics up. However, the Q3 figures remain well above historical levels.
The financial challenges of the last two years were apparent in one striking metric for Q3: over one-third of the announced transactions involved a party for which financial distress was cited as a driver for the transaction, also well above historical benchmarks.
Overview of Q3 Activity
The 18 announced transactions in Q3 were significantly above the numbers for Q3 2021 and 2022 and at par with the number of transactions announced in Q3 of 2018 and 2020. Throughout the year, we have seen transaction activity regaining momentum, a trend we anticipated in our 2022 year-end report.
Figure 1: Number of Q3 Announced Transactions, by Year
Source: Kaufman, Hall & Associates, LLC
The average size of the seller or smaller party, as measured by annual revenues, was $453 million. This was closer to—but still above—pre-pandemic historical year-end averages, which ranged from $272 million to $409 million from 2017 through 2019.
Figure 2: Average Seller Size by Revenue ($ in Millions), Q3 2023 Compared with Year-end Averages
Source: Kaufman, Hall & Associates, LLC
Total transacted revenue was $8.2 billion, which is on the higher side of recent historical numbers for Q3. This figure was down significantly from Q2 2023, which had $13.3 billion in total transacted revenue, driven primarily by the three announced mega mergers in Q2, compared to just one in Q3. When removing the mega mergers from each quarter, the average revenue in Q3 was actually significantly higher than that of Q2, at $243 million and $159 million respectively, demonstrating the significant uptick in activity in sizeable independent hospitals seeking out partnerships with larger organizations.
Figure 3: Total Q3 Transacted Revenue ($ in Billions), by Year
Source: Kaufman, Hall & Associates, LLC
Not-for-profit health systems were the acquiring or larger party in 14 of Q3’s 18 announced transactions, with for-profit systems acting as the acquiring party in the remaining four transactions. Of the 14 not-for-profit acquirers, seven were academic/university-affiliated organizations (see discussion below) and one was a religiously affiliated organization. The four transactions in which a for-profit system acted as acquirer focused primarily on smaller, financially distressed organizations: three of the four acquired organizations were financially distressed.
Financial Challenges Emerge as a Key Transaction Driver
As has been noted in Kaufman Hall’s monthly National Hospital Flash Report, hospitals and health systems have been under extreme financial pressure since 2022, when median operating margins remained in negative territory for the full year. The situation has improved somewhat in 2023, with year-to-date median operating margins now slightly above 1%, but this figure is well below the 3% or higher operating margin that is necessary for long-term financial sustainability (Figure 4). These challenges are reflected in the 39% percent of announced transactions in Q3 in which a party has cited, or publicly available information has enabled Kaufman Hall to infer, an element of financial distress as a transaction driver.
Figure 4: U.S. Hospital Year-to-Date Operating Margin Index, September 2021-August 2023
Source: Kaufman, Hall & Associates, LLC. The Kaufman Hall Hospital Operating Margin and Operating Margin Index is composed of the national median of our dataset adjusted for allocations to hospitals from corporate, physician, and other entities.
For many smaller to medium-sized health systems, the upward reset in fixed costs—including both labor and non-labor expenses—is a particularly acute problem. Their relative size constrains their ability to spread these costs across a larger number of facilities and services. We are seeing continued activity among systems with annual revenues in the range of $250 million to $750 million that have sought a partner. What is new in recent quarters is the number of larger systems—those with annual revenues of $1 billion or more—that also are citing financial distress as a driver for their decision to partner.
Academic Health Systems Seek Community Partners
Fourteen of the 18 announced transactions in Q3 2023 involved not-for-profit acquirers, and of those 14, 50% were academic or university-affiliated health systems.
Whereas volumes have been slow to recover to pre-pandemic levels at many health systems, academic health systems are seeing significantly higher occupancy levels. A recent analysis of Kaufman Hall National Hospital Flash Report data showed a median inpatient occupancy rate of 70% at academic health centers, compared to a 53% occupancy rate at acute-care hospitals generally.
Aligning an academic health system with a community-based health system provides the opportunity to relieve some of the occupancy pressures at the academic flagship hospital by utilizing available space in high-quality community hospitals to treat lower acuity patients. An academic/community health system pairing also offers expanded opportunities for residency programs, clinical research trials, and patient access to tertiary and quaternary services.
Participatory Partnership Structures
Health systems are also engaging in creative transaction structures that allow partners to maintain their independence while building strategic alliances that enhance access to care. Announced transactions in Q3 included UVA Health’s acquisition of a 5% ownership interest in Riverside Health System as part of a strategic alliance designed “to expand patient access to innovative care for complex medical conditions, transplantation, and the latest clinical trials.”[2] In a similar transaction, Novant Health acquired a 30% minority stake in Conway Medical Center in Conway, South Carolina. This alliance is intended to address the healthcare needs of residents in the Grand Strand and Pee Dee regions of South Carolina, which are seeing rapid population growth.[3]
Looking Forward
While partnership, merger, and acquisition activity is returning to pre-pandemic levels, regulatory scrutiny of these transactions is also increasing. New proposed merger guidelines were issued by the Federal Trade Commission (FTC) and the Department of Justice (DOJ) in July, and a lawsuit filed in September by the FTC against U.S. Anesthesia Partners in Texas is seen as an early test of the proposed guidelines, targeting physician practice roll-up transactions. State attorneys general are also being given expanded authority to review proposed transactions. There are many compelling reasons for hospitals, health systems, and other healthcare organizations to seek new alliances and partnerships in the current operating environment. The effect of new guidelines on these transactions will remain unknown until they have been tested in the federal and state judicial systems.
About the authors
Anu Singh, Managing Director and Leader of the Partnerships, Mergers & Acquisitions Practice
Kris Blohm, Managing Director
Nora Kelly, Managing Director
Eb LeMaster, Managing Director
Courtney Midanek, Managing Director
Rob Gialessas, Vice President
Chris Peltola, Vice President
Originally published at https://www.kaufmanhall.com


