


Johns Hopkins Coronavirus Resource Center
January 16, 2022
Excerpted from the publication below, with the analysis and title above given by the editor of the blog — Joaquim Cardoso MSc.
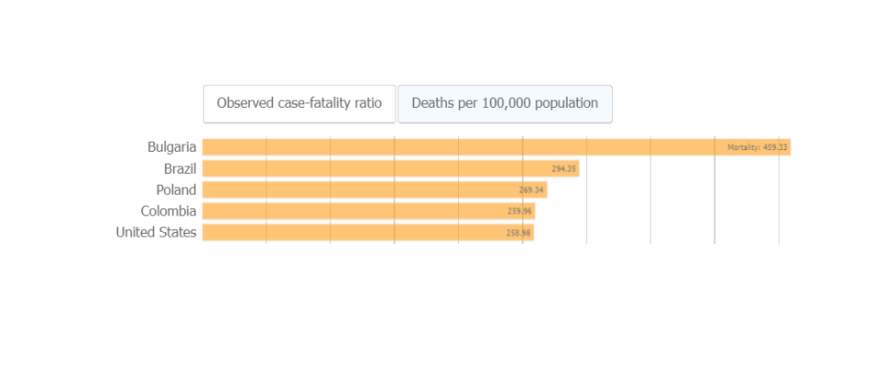
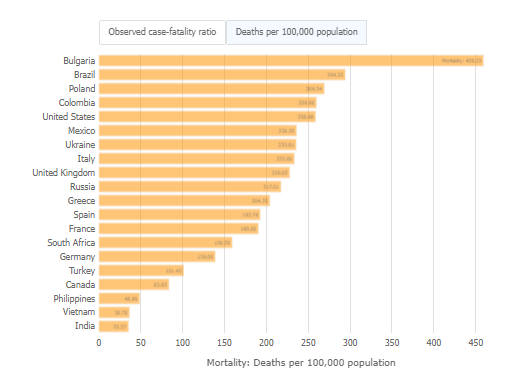
Mortality in the most affected countries
For the twenty countries currently most affected by COVID-19 worldwide, the bars in the chart below show the number of deaths either per 100 confirmed cases (observed case-fatality ratio) or per 100,000 population (this represents a country’s general population, with both confirmed cases and healthy people).
Countries at the top of this figure have the most deaths proportionally to their COVID-19 cases or population, not necessarily the most deaths overall.
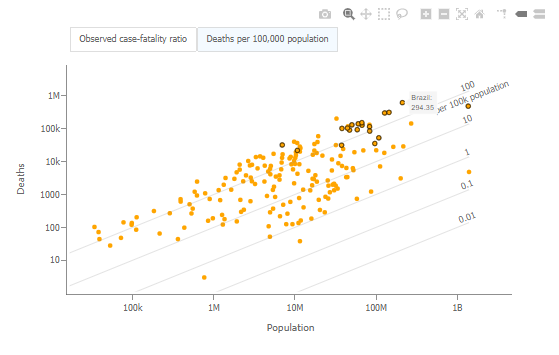
Worldwide mortality
The diagonal lines on the chart below correspond to different case fatality ratios (the number of deaths divided by the number of confirmed cases). Countries falling on the uppermost lines have the highest observed case fatality ratios.
Points with a black border correspond to the 20 most affected countries by COVID-19 worldwide, based on the number of deaths. Hover over the circles to see the country name and a ratio value.
Use the boxes on the top to toggle between: 1) mortality per absolute number of cases (total confirmed cases within a country); and mortality per 100,000 people (this represents a country’s general population, with both confirmed cases and healthy people).
Cases and mortality by country


See the original publication
Originally published at
ABOUT THIS PAGE:
This page was last updated on Sunday, January 16, 2022 at 06:07 AM EST.
How does mortality differ across countries?
One of the most important ways to measure the burden of COVID-19 is mortality. Countries throughout the world have reported very different case fatality ratios – the number of deaths divided by the number of confirmed cases. Differences in mortality numbers can be caused by:
- Differences in the number of people tested: With more testing, more people with milder cases are identified. This lowers the case-fatality ratio.
- Demographics: For example, mortality tends to be higher in older populations.
- Characteristics of the healthcare system: For example, mortality may rise as hospitals become overwhelmed and have fewer resources.
- Other factors, many of which remain unknown.
Johns Hopkins experts in global public health, infectious disease, and emergency preparedness have been at the forefront of the international response to COVID-19.
This website is a resource to help advance the understanding of the virus, inform the public, and brief policymakers in order to guide a response, improve care, and save lives.
This Project is supported by Bloomberg Philanthropies and the Stavros Niarchos Foundation (SNF).