


Cancer Cell
Jana Lipkova,1,2,3,4 Richard J. Chen,1,2,3,4,5 Bowen Chen,1,2,8 Ming Y. Lu,1,2,3,4,7 Matteo Barbieri,1 Daniel Shao,1,2,6 Anurag J. Vaidya,1,2,6 Chengkuan Chen,1,2,3,4 Luoting Zhuang,1,3 Drew F.K. Williamson,1,2,3,4 Muhammad Shaban,1,2,3,4 Tiffany Y. Chen,1,2,3,4 and Faisal Mahmood1,2,3,4,9, *
OCTOBER 10, 2022
Executive Summary by:
Joaquim Cardoso MSc
health transformation . institute
October 16, 2022
Overview
Background:
- In oncology, the patient state is characterized by a whole spectrum of modalities, ranging from radiology, histology, and genomics to electronic health records.
- Current artificial intelligence (AI) models operate mainly in the realm of a single modality, neglecting the broader clinical context, which inevitably diminishes their potential.
- Integration of different data modalities provides opportunities to increase robustness and accuracy of diagnostic and prognostic models, bringing AI closer to clinical practice.
- AI models are also capable of discovering novel patterns within and across modalities suitable for explaining differences in patient outcomes or treatment resistance.
- The insights gleaned from such models can guide exploration studies and contribute to the discovery of novel biomarkers and therapeutic targets.
Scope of the paper:
- To support these advances, here we present a synopsis of AI methods and strategies for multimodal data fusion and association discovery.
- We outline approaches for AI interpretability and directions for AI-driven exploration through multimodal data interconnections.
- We examine challenges in clinical adoption and discuss emerging solutions.
Structure of the publication:
- Introduction
- AI methods in oncology
- Multimodal data fusion
- Multimodal interpretability
- Multimodal data interconnection
- Challenges and clinical adoption
- Outlook and discussion
Outlook and discussion [excerpt]
- AI has the potential to have an impact on the whole landscape of oncology, ranging from prevention to intervention.
- AI models can explore complex and diverse data to identify factors related to high risks of developing cancer to support large population screenings and preventive care.
- The models can further reveal associations across modalities to help identify diagnostic or prognostic biomarkers from easily accessible data to improve patient risk stratification or selection for clinical trials.
- In a similar way, the models can identify non-invasive alternatives to existing biomarkers to minimize invasive procedures.
- Prognostic models can predict risk factors or adverse treatment outcomes prior to interventions to guide patient management.
- Information acquired from personal wearable devices or nanotechnologies could be further analyzed by AI models to search for early signs of treatment toxicity or resistance, with other great application yet to come.
Implications and Next Steps:
- As with any great medical advance, there is a need for rigorous validation and examination via clinical studies, prospective trials to verify the promises made by AI models.
- The role of AI in advancing the field of oncology is not autonomous; rather, it is a partnership between models and human experience that will drive further progress.
- AI models come with limitations and challenges; however, these should not intimidate but rather inspire us.
- With increasing incidence rates of cancer, it is our obligation to capitalize on benefits offered by AI methods to accelerate discovery and translation of advances into clinical practice to serve patients and health care providers.
Infographic
Figure 1- AI-driven multimodal data integration
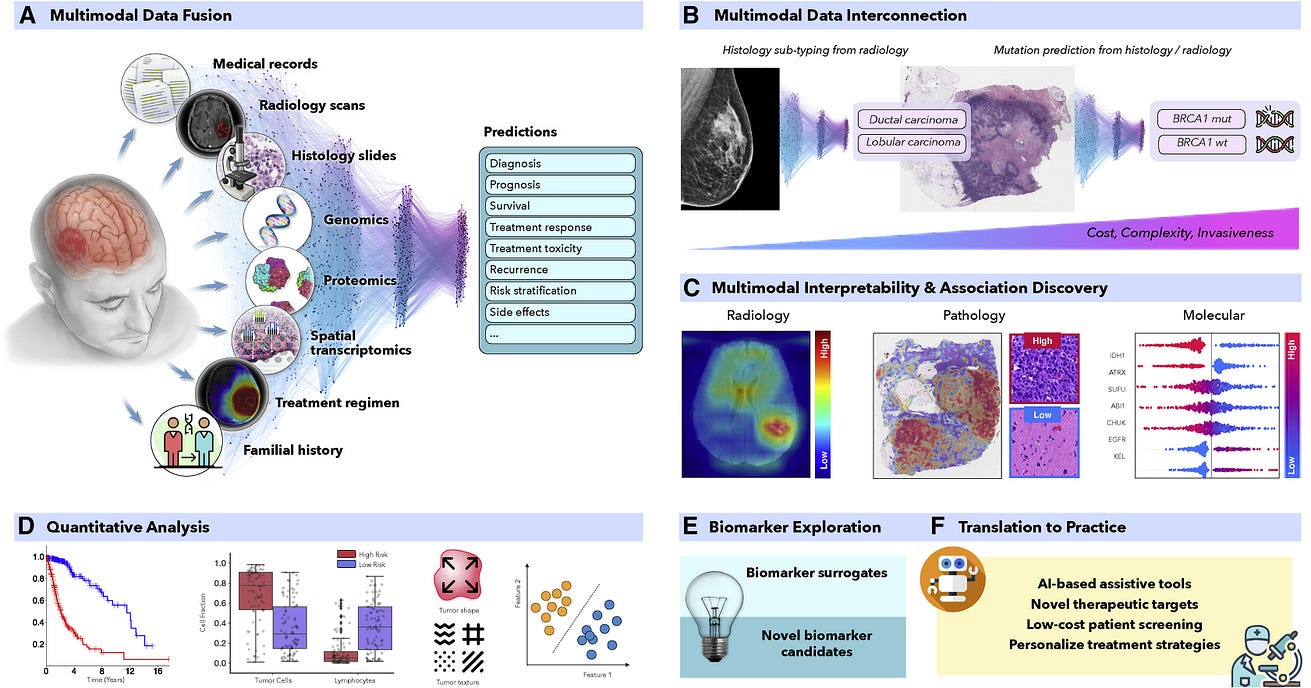
Figure 2. Overview of AI methods
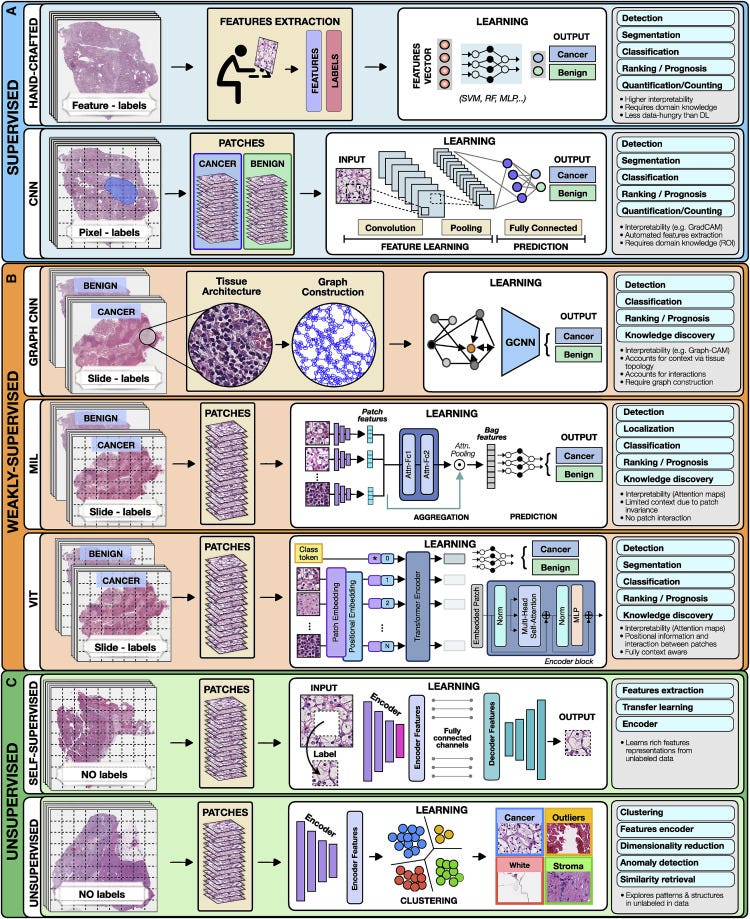
Figure 3 — Multimodal data fusion
ORIGINAL PUBLICATION
Artificial intelligence for multimodal data integration in oncology
Cancer Cell
Jana Lipkova,1,2,3,4 Richard J. Chen,1,2,3,4,5 Bowen Chen,1,2,8 Ming Y. Lu,1,2,3,4,7 Matteo Barbieri,1 Daniel Shao,1,2,6 Anurag J. Vaidya,1,2,6 Chengkuan Chen,1,2,3,4 Luoting Zhuang,1,3 Drew F.K. Williamson,1,2,3,4 Muhammad Shaban,1,2,3,4 Tiffany Y. Chen,1,2,3,4 and Faisal Mahmood1,2,3,4,9, *
OCTOBER 10, 2022
Introduction
Cancer is a highly complex disease involving a cascade of microscopic and macroscopic changes with mechanisms and interactions that are not yet fully understood. Cancer biomarkers provide insights into the state and course of disease in the form of quantitative or qualitative measurements, which consequently guide patient management. Based on their primary use, biomarkers can be diagnostic, prognostic or predictive of response and resistance to treatment. Diagnostic markers stand at the first line of cancer detection and diagnosis, including examples such as prostate-specific antigen (PSA) values, indications in radiologic imaging or neoplastic changes in a tissue biopsy. Examples of predictive markers include microsatellite instability which is commonly used to predict response to immune-checkpoint-inhibitor therapy in colorectal cancer (Marcus et al., 2019), and KRAS mutations used to indicate resistance to anti-EGFR treatment (Van Cutsem et al., 2009). Prognostic markers forecast risks associated with clinical outcomes such as survival, recurrence, or disease progression. Such prognostic markers range from tumor grade and stage to genomic and transcriptomic assays such as Oncotype DX and Prosigna (PAM50), often used to estimate recurrence and survival likelihood (Paik et al., 2004). Despite the vital role of biomarkers, patients with similar profiles can exhibit diverse outcomes, treatment responses (Shergalis et al., 2018), recurrence rates (Roy et al., 2015), or treatment toxicity (Kennedy and Salama, 2020), while the underlying reasons for such dichotomies largely remain unknown. There is a crucial need to identify novel and more-specific biomarkers. Modern cancer centers acquire a cornucopia of data over the course of a patient’s diagnosis and treatment trajectory, ranging from radiology, histology, clinical and laboratory tests, to familial and patient histories, with each modality providing additional insights on the patient state. A holistic framework integrating complementary information and clinical context from diverse data sources would enable discovery of new, highly-specific biomarkers, paving the path to the next generation of personalized medicine, as illustrated in Figure 1. An analysis of possible correlation and patterns across diverse data modalities can easily become too complex during subjective analysis, making it an attractive application for AI-methods (Boehm et al., 2022). The capacity of AI models to leverage diverse complementary information from multimodal data and identify predictive features within and across modalities allows for automated and objective exploration and discovery of novel biomarkers. Additionally, AI can identify accessible surrogates for existing, but highly-specialize yet expensive markers, to facilitate the spread of advanced targeted therapies and large-scale population screenings.

Figure 1. AI-driven multimodal data integration
(A and C–F) (A) AI models can integrate complementary information and clinical context from diverse data sources to provide more accurate outcome predictions. The clinical insights identified by such models can be further elucidated through © interpretability methods and (D) quantitative analysis to guide and accelerate the discovery of new biomarkers or therapeutic targets (E and F).
(B) AI can reveal novel multimodal interconnections, such as relations between certain mutations and changes in cellular morphology or associations between radiology findings and histology tumor subtypes or molecular features. Such associations can serve as non-invasive or cost-efficient alternatives to existing biomarkers to support large-scale patient screening (E and F).
Historically, the biomarker discovery process has typically involved the examination of potentially informative qualitative features (such as tissue morphology) or quantitative measurements (such as genomic, transcriptomic alterations) and their association with clinical endpoints. For instance, standardized morphologic assesment pipelines such as the the Nottingham grading system in breast cancer (Rakha et al., 2008) and the Gleason grading in prostate cancers (Epstein et al., 2016) was determined through dedicated examination of thousands of histopathology slides, revealing associations between morphological features and patient outcome. Although the identification of each new biomarker represents a milestone in oncology, this process faces several challenges. Manual assessment is time and resource intensive, often without the possibility of translating observations from one cancer model to another. Morphologic cancer assessment is often qualitative, with substantial interrater variability, which hinders reproducibility and contributes to inconsistent outcomes in clinical trials. Given the large complexity of medical data, current biomarkers are mostly unimodal. However, constraining the biomarkers to a single modality can significantly reduce their clinical potential. For instance, glioma patients with similar genetic or histology profiles can have diverse outcomes caused by macroscopic factors, such as a tumor location preventing full resection and irradiation or disruption of the blood-brain barrier, altering the efficacy of drug delivery (Miller, 2002).
Over the past years, artificial intelligence (AI) and in particular representation learning methods have demonstrated great performance in many clinically relevant tasks inclusing tasks that are often not trivial for human observers (Bera et al., 2019, Lu et al., 2021). AI models are able to integrate complementary information and clinical context from diverse data sources to provide more accurate patient predictions (Figure 1A) (Hosny et al., 2018). The clinical insights identified by successful models can be further elucidated through interpretability methods and quantitative analysis to guide and accelerate the discovery of new biomarkers (Figures 1C and 1D). Similarly, AI models can discover associations across multiple modalities, such as relations between certain mutations and specific changes in cellular morphology (Coudray et al., 2018) or associations between radiology findings and histology-specific tumor subtypes (Ferreira-Junior et al., 2020; Hyun et al., 2019) or molecular features (Yan et al., 2021) (Figure 1B). Such associations can identify accessible or non-invasive alternatives for existing biomarkers to support large-scale population screenings or selection of patients for clinical trials (Figures 1E and 1F). In this review, we summarize AI methods and strategies for multimodal data fusion, outline prospective on AI driven exploration through multimodal associations and interpretability methods, and conclude with directions for AI adoption in precision oncology.
AI methods in oncology
AI methods can be categorized as supervised, weakly supervised, or unsupervised. To highlight the concepts specific to each category we present all methods in the framework of computer vision as applied to digital pathology (Figure 2).
Figure 2. Overview of AI methods
(A) Supervised methods use strong supervision whereby each data point (e.g., feature or image patch) is assigned a label.
(B) Weakly supervised methods allow one to train the model with weak, patient-level labels, avoiding the need for manual annotations.
© Unsupervised methods explore patterns, subgroups, and structures in unlabeled data. For comparison, all methods are illustrated on a binary cancer detection task.
Supervised methods
Supervised methods map input data to predefined labels (e.g., cancer/non-cancer) using annotated data points such as digitized slides with pixel-level annotations, or radiology images with patient outcome. Examples of fully supervised methods include hand-crafted and representation learning methods.
Hand-crafted methods
These methods take as input a set of predefined features (e.g., cell shape or size) extracted from the data before the training, not the data themselves. The training is performed with standard machine-learning (ML) models, such as random forest (RF), support-vector machine (SVM), or multilayer perceptron (MLP) (Bertsimas and Wiberg, 2020) (Figure 2). Since the feature extraction is not part of the learning process, the models typically have simpler architecture, lower computation cost, and may require less training data than DL models. An additional benefit is a high level of interpretability, since the predictive features can be related to the data. On the other hand, the feature extraction is time consuming and can translate human bias to the models. A downside is that manual feature extraction or engineering limits the models ability to features already known and understood by humans and prevents the utility and downstream discovery of new relevent features. Moreover, human perception cannot be easily captured by a set of mathematical operators, often leading to simpler features. Since the features are usually tailored to the specific disease, the models cannot be easily translated to other tasks or malignancies. Despite the popularity of DL methods, in many applications the hand-crafted methods are sufficient and preferred due to their simplicity and ability to learn from smaller datasets.
Representation learning methods
Representation learning methods such as deep learning (DL) are capable of learning rich feature representations from the raw data without the need for manual feature engineering. Here we focus on convolutional neural networks (CNNs), the most common DL strategy for image analysis. In CNNs the predictive features are not defined, and the model learnins which concepts and features are useful for explaining relations between inputs and outputs. For instance, in Figure 2, each training whole-slide image (WSI) is manually annotated to outline the tumor region. The WSI is then partitioned into rectangular patches and each patch is assigned with a label, “cancer” or “no-cancer,” determined by the tumor annotation. The majority of CNNs have similar architectures, consisting of alternating convolutional, pooling, and non-linear activation layers, followed by a small number of fully connected layers. A convolution layer serves as a feature extractor, while the subsequent pooling layer condenses the features into the most relevant ones. The non-linear activation function allows the model to explore complex relations across features. Fully connected layers then perform the end task, such as classification. The main strength of CNNs is their ability to extract rich feature representations from raw data, resulting in lower preprocessing cost, higher flexibility, and often superior performance over hand-crafted models. The potential limitations come from the model’s reliance on pixel-level annotations, which are time intensive and might be affected by interrater variability and human bias. Moreover, predictive regions for many clinical outcomes, such as survival or treatment resistance, may be unknown. CNNs are also often criticized for their lack of interpretability, while we are able to often examine regions used by the model to make predictive determinations, the overall feature representations remain abstract. Despite these limitations, CNNs come with impressive performance, contributing to widespread usage in many clinically relevent applications.
Weakly supervised methods
Weakly supervised learning is a sub-category of supervised learning with batch annotations on large clusters of data essentially representing a scenario where the supervisory signal is weak compared to the amount of noise in the dataset. A common example of the utility of weak supervision is detection of small tumor regions in a biopsy or resection in a large gigapixel whole slide image with labels at the level of the slide or case. Weakly supervised methods allow one to train models with weak, patient-level labels (such as diagnosis or survival), avoiding the need for manual data annotations. The most common weakly supervised methods include graph convolutional networks (GCNs), multiple-instance learning (MIL), and vision transformers (VITs).
Graph convolutional networks
Graphs can be used to explicitly capture structure within data and encode relations between objects making them ideal for analysis of tissue biospy images. A graph is defined by nodes connected by edges. In histology, a node can represent a cell, an image patch, or even a tissue region. Edges encode spatial relations and interactions between nodes (Zhang et al., 2019). The graph, combined with the patient-level labels, is processed by a GCN (Ahmedt-Aristizabal et al., 2021), which can be seen as a generalization of CNNs that operate on unstructured graphs. In GCNs, feature representations of a node are updated by aggregating information from neighboring nodes. The updated representations then serve as input for the final classifier (Figure 2). GCNs can incorporate larger context and spatial tissue structure as compared to a conventional deep models for digital pathology which patch the image into small regions which remain mutually exclusive. This can be beneficial in tasks where the spatial context spans beyond the scope of a single patch (e.g., Gleason score). On the other hand, the interdependence of the nodes in GCNs comes with higher training costs and memory requirements, since the nodes cannot be processed independently.
Multiple-instance learning
MIL is a type of weakly supervised learning where multiple instances of the input are not individually labeled and the supervisory signal is only available collectively for a set of instances commonly reffered to as a bag (Carbonneau et al., 2018; Cheplygina et al., 2019) The label of a bag is assumed positive if there is at least one positive instance in the bag. The goal of the model is to predict the bag label. MIL models comprise three main modules: feature learning or extraction, aggregation, and prediction. The first module is used to embed the images or other higher dimentional data into lower-dimensional embeddings this module can be trained on the fly (Campanella et al., 2019) or a pre-trained encoder from supervised or self-supervised learning can be used to reduce training time and data-efficiency (Lu et al., 2021). The instance-level embeddings are aggregated to create patient-level representations, which serve as input for the final classification module. A commonly used aggrigation stratergy is attention-based pooling, (Ilse et al., 2018), where two fully connected networks are used to learn the relative importance of each instance (Ilse et al., 2018). The patch-level representations, weighted by the corresponding attention score, are summed up to build the patient-level representation. The attention scores can be also be used in understanding the predictive basis of the model (see “multimodal interpretability” for additional details). In large scale medical datasets fine annotations are often not available which makes MIL an ideal approach for training deep models, there are several recent examples in cancer pathology (Campanella et al., 2019, Lu et al., 2021, Lu et al., 2021) and genomics (Sidhom et al., 2021).
Vision transformers
VITs (Dosovitskiy et al., 2020; Vaswani et al., 2017) are a type of attention-based learning which allows for the model to be fully context aware. In contrast to MIL, where patches are assumed independent and identically distributed, VITs account for correlation and context among patches. The main components of VITs include positional encoding, self-attention, and multihead self-attention. Positional encoding learns the spatial structure of the image and the relative distances between patches. The self-attention mechanism determines the relevance of each patch while also accounting for the context and contributions from the other patches. Multihead self-attention simultaneously deploys multiple self-attention blocks to account for different types of interactions between the patches and combines them into a single self-attention output. A typical VIT architecture is shown in Figure 2. A WSI is converted into a series of patches, each coupled with positional information. Learnable encoders map each patch and its position into a single embedding vector, referred to as a token. An additional tokens is introduced for the classification task. The class token together with the patch tokens is fed into the transformer encoder to compute multihead self-attention and output the learnable embeddings of patches and the class. The output class token serves as a slide-level representation used for the final classification. The transformer encoder consists of several stacked identical blocks. Each block includes multihead self-attention and MLP, along with layer normalization and residual connections. The positional encoding and multiple self-attention heads allow one to incorporate spatial information, increase the context and robustness (Li et al., 2022; Shamshad et al., 2022) of VIT methods over other methods. On the other hand, VITs tend to be more data hungry (Dosovitskiy et al., 2020), a limitation that the machine learning community is actively working to overcome.
Weakly supervised methods offer several benefits. The liberation from manual annotations reduces the cost of data preprocessing and mitigates the bias and interrater variability. Consequently, the models can be easily applied to large datasets, diverse tasks, and also situations where the predictive regions are unknown. Since the models are free to learn from the entire scan, they can identify predictive features even beyond the regions typically evaluated by pathologists. The great performance demonstrated by weakly supervised methods suggests that many tasks can be addressed without expensive manual annotations or hand-crafted features.
Unsupervised methods
Unsupervised methods explore structures, patterns, and subgroups in data without relying on any labels. These include self-supervised and fully unsupervised strategies.
Self-supervised methods
Self-supervised methods aim to learn rich feature representations from within data by posing the learning problem as a task the ground truth for which is defined within the data. Such encoders are often used to obtain high quality lower dimentional embeddings of complex high dimentional datasets for making downstream tasks more efficient interms of data and training efficiency. For example in pathology images self-supervised methods exploit available unlabeled data to learn high-quality image features and then transfer this knowledge to supervised models. To achieve this, supervised methods such as CNNs are used to solve various pretext tasks (Jing and Tian, 2019) for which the labels are generated automatically from the data. For instance, a patch can be removed from an image and a deep network is trained to predict the missing part of the image from its surroundings, using the actual patch as a label (Figure 2). The patch prediction has no direct clinical relevance, but it guides the model to learn general-purpose features of image characteristics, which can be beneficial for other practical tasks. The early layers of the network are usually capture general image features, while the later layers pick features relevant for the task at hand. The later layers can be excluded, while the early layers serve as feature extractors in for supervised models (i.e., transfer learning).
Unsupervised feature analysis
These methods allow for exploring structure, similarity and common features across data points. For example, using embeddings from a pre-trained encoder one could extract features from a large dataset of diverse patients and cluster said embeddings to find common features across the entire patient cohorts. The most common unsupervised methods include clustering and dimensionality reduction. Clustering methods (Rokach and Maimon, 2005) partition data into subgroups such that the similarities within the subgroup and the separation between subgroups are maximized. Although the output clusters are not task specific, they can reveal different cancer subtypes or patient subgroups. The aim of dimensionality reduction is to obtain low-dimensional representation capturing the main characteristics and correlations in the data.
Multimodal data fusion
The aim of multimodal data fusion is to extract and combine complementary contextual information across different modalities for better decision-making (Zitnik et al., 2019). This is of particular relevance in medicine, where similar findings in one modality may have diverse interpretations in combination with other modalities (Iv et al., 2021). For instance, an IDH1 mutation status or histology profile alone is insufficient for explaining the variance in patient outcomes, whereas the combination of both has been recently used to redefine the WHO classification of diffuse glioma (Louis et al., 2016). AI offers an automated and objective way to incorporate complementary information and clinical context from diverse data for improved predictions. Multimodal data-driven AI models can also utilize complementary and supplementary information in modalities; if unimodal data are noisy or incomplete, supplementing redundant information from other modalities can improve the robustness and accuracy of the predictions. AI-driven data fusion strategies (Baltrušaitis et al., 2018) can be divided as early, late, and intermediate (see Figure 3).
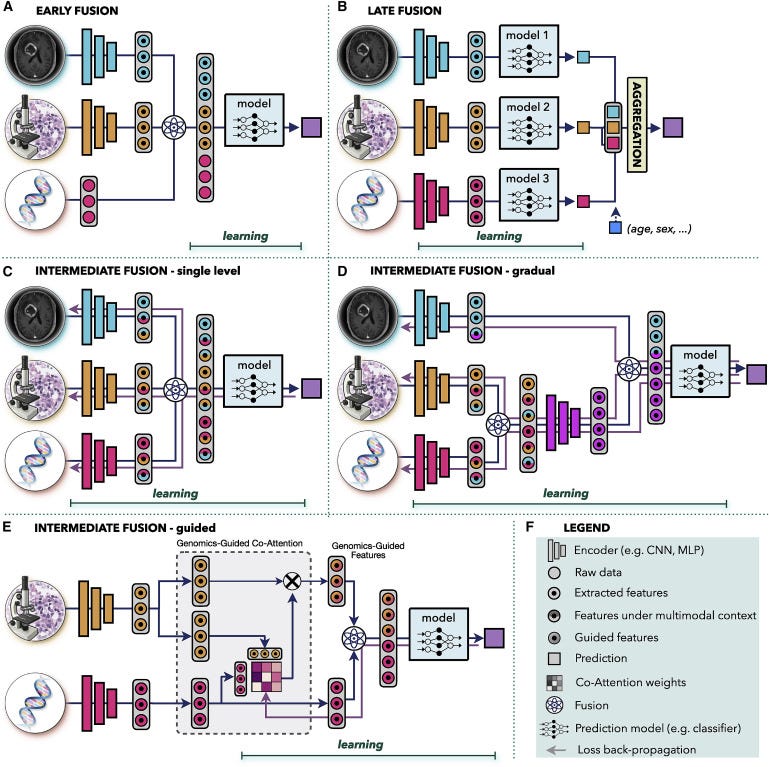
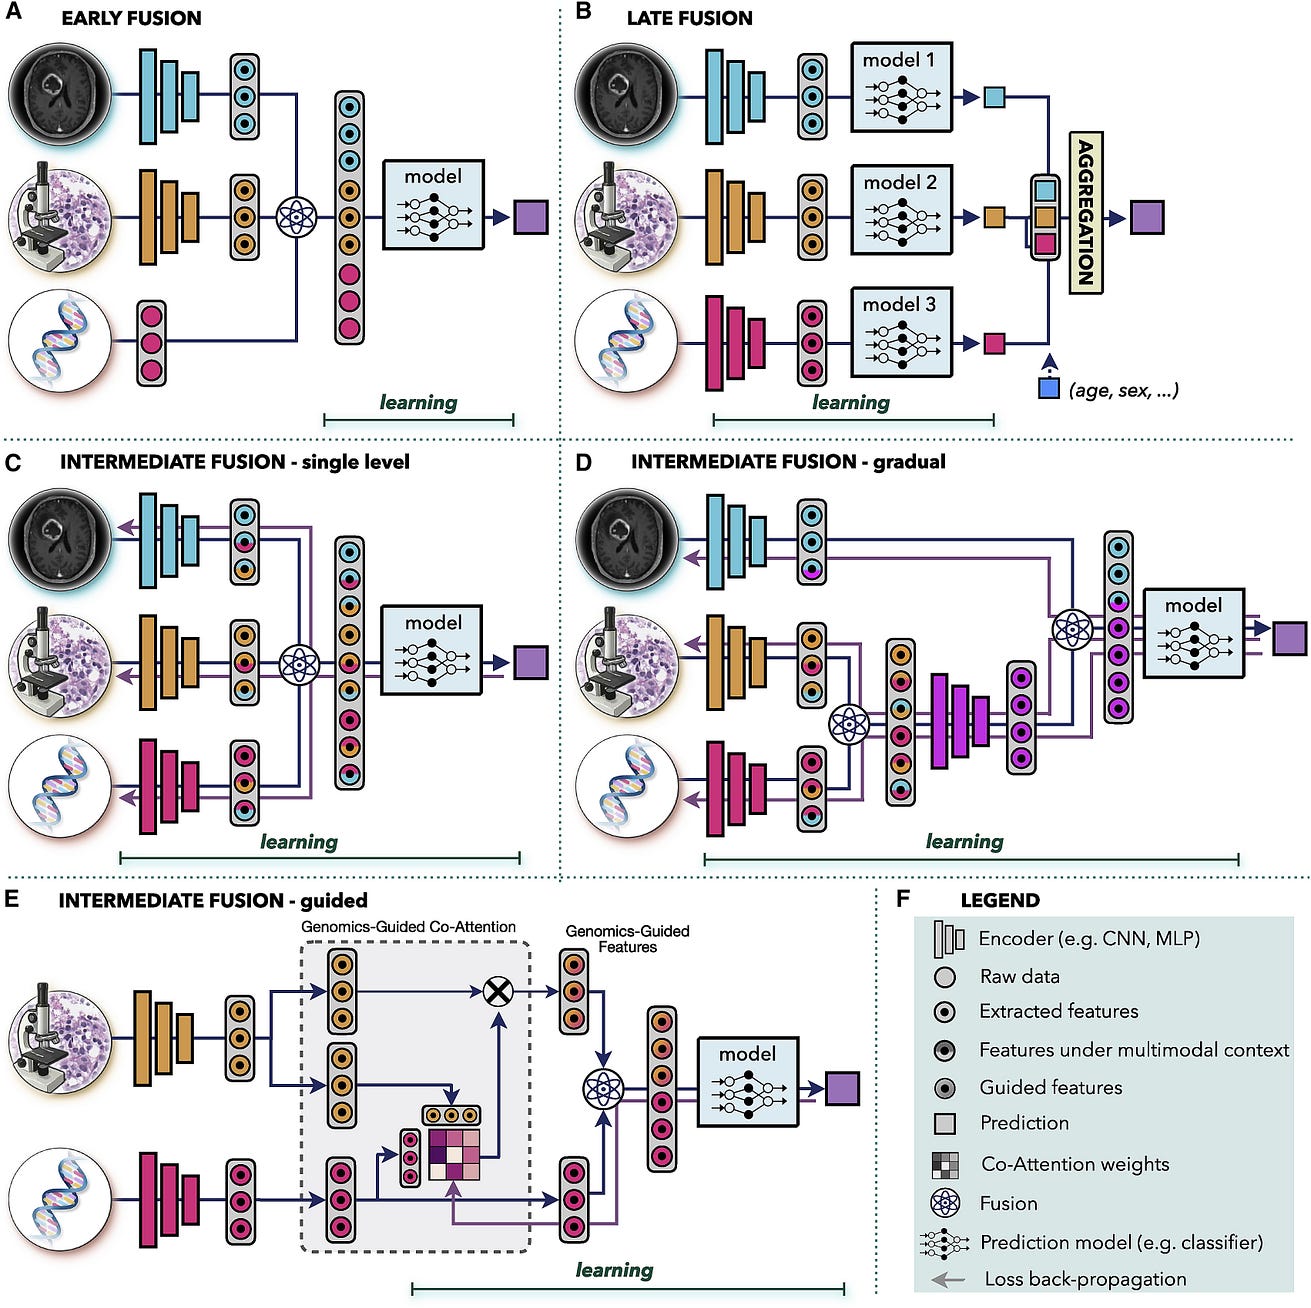
Figure 3. Multimodal data fusion
(A) Early fusion builds a joint representation from raw data or features at the input level, before feeding it to the model.
(B) Late fusion trains a separate model for each modality and aggregates the predictions from individual models at the decision level.
(C–E) In intermediate fusion, the prediction loss is propagated back to the feature extraction layer of each modality to iteratively learn improved feature representations under the multimodal context. The unimodal data can be fused © at a single level or (D) gradually in different layers.
(E) Guided fusion allows the model to use information from one modality to guide feature extraction from another modality.
(F) Key for the symbols used.
Early fusion
Early fusion integrates information from all modalities at the input level before feeding it into a single model. The modalities can be represented as raw data, hand crafted, or deep features. The joint representation is built through operations such as vector concatenation, element-wise sum, element-wise multiplication (Hadamard product), or bilinear pooling (Kronecker product) (Huang et al., 2020; Ramachandram and Taylor, 2017). In early fusion, only one model is trained, which simplifies the design process. However, it is assumed that the single model is well suited to all modalities. Early fusion requires a certain level of alignment or synchronization between the modalities. Although this is more obvious in other domains, such as synchronization of audio and visual signals in speech recognition, it is also relevant in clinical settings. If the modalities come from significantly different time points, such as pre- and postinterventions, then early fusion might not be an appropriate choice.
Applications of early fusion include integration of similar modalities such as multimodal, multiview ultrasound images for breast cancer detection (Qian et al., 2021) or fusion of structural computed tomography (CT) and/or MRI data with metabolic positron emission tomography (PET) scans for cancer detection (Le et al., 2017), treatment planning (Lipková et al., 2019), or survival prediction (Nie et al., 2019). Other examples include fusion of imaging data with electronic medical records (EMRs), such as integration of dermoscopic images and patient data for skin lesion classification (Yap et al., 2018), or fusion of a cervigram and EMRs for cervical dysplasia diagnosis (Xu et al., 2016). Several studies investigate the correlation between changes in gene expression and tissue morphology, integrating genomics data with histology and/or radiology images for cancer classification (Khosravi et al., 2021), survival (Chen et al., 2020b, 2021c), and treatment response (Feng et al., 2022; Sammut et al., 2022) prediction.
Late fusion
Late fusion, also known as decision-level fusion, trains a separate model for each modality and aggregates the predictions from individual models for the final prediction. The aggregation can be performed by averaging, majority voting, Bayes-based rules (Ramanathan et al., 2022), or learned models such as MLP. Late fusion allows one to use a different model architecture for each modality and does not pose any constraints on data synchronization, making it suitable for systems with large data heterogeneity or modalities from different time points. In cases of missing or incomplete data, late fusion retains the ability to make predictions, since each model is trained separately, and aggregations, such as majority voting, can be applied even if a modality is missing. Similarly, inclusion of a new modality can be performed without the need to retrain the full model. Simple covariates, such as age or gender, are often included through late fusion due to its simplicity (see Figure 3B). If the unimodal data do not complement one another or do not have strong interdependencies, late fusion might be preferable thanks to the simpler architecture and smaller number of parameters compared with other fusion strategies. This is also beneficial in situations with limited data. Furthermore, errors from individual models tend to be uncorrelated, resulting in potentially lower bias and variance in late-fusion predictions. In situations when information density varies significantly across modalities, predictions from shared representations can be heavily influenced by the most dominant modality. In late fusion, the contribution from each modality can be accounted for in a controlled manner by setting equal or diverse weights per modality in the aggregation step.
Examples of late fusion include integration of imaging data with non-imaging inputs, such as fusion of MRI scans and PSA blood tests for prostate cancer diagnosis (Reda et al., 2018), integration of histology scans and patient gender for inferring origin of metastatic tumors (Lu et al., 2021), fusion of genomics and histology profiles for survival prediction (Chen et al., 2021c; Shao et al., 2019), combination of pretreatment MRI or CT scans with EMRs for chemotherapy response prediction (Joo et al., 2021), and survival estimation (Nie et al., 2016).
Intermediate fusion
This is a strategy wherein the loss from the multimodal model propagates back to the feature extraction layer of each modality to iteratively improve feature representations under the multimodal context. For comparison, in early and late fusion, the unimodal embeddings are not affected by the multimodal information. Intermediate fusion can combine individual modalities at different levels of abstractions. Moreover, in systems with three or more modalities the data can be fused either all at once (Figure 3C) or gradually across different levels (Figure 3D). The intermediate single-level fusion is similar to early fusion; however, in early fusion the unimodal embeddings are not affected by the multimodal context. Gradual fusion allows one to combine data from highly correlated channels at the same level, forcing the model to consider the cross-correlations between specific modalities, followed by fusion with less correlated data in later layers. For instance, in Figure 3D, genomics and histology data are fused first, to account for the interplay between mutations and changes in the tissue morphology, while the relation with the macroscopic radiology data is considered in the later layer. Gradual fusion has shown improved performance over single-level fusion in some applications (Joze et al., 2020; Karpathy et al., 2014). Lastly, guided-fusion allows model to use informaiton from one modality to guide feature extraction from another modality. For instance, in Figure 2E, genomics information guides the selection of histology features. The motivation is that different tissue regions might be relevant in the presence of specific mutations. Guided fusion learns co-attention scores that reflect the relevance of different histology features in the presence of specific molecular information. The co-attention scores are learned with the multimodal model, where the genomics feature and the corresponding genomics-guided histology features are combined for the final model predictions.
Examples of intermediate fusion include integration of diverse imaging modalities, such as the fusion of PET and CT scans in lung cancer detection (Kumar et al., 2019), fusion of MRI and ultrasound images in prostate cancer classification (Sedghi et al., 2020), or combination of multimodel MRI scans in glioma segmentation (Havaei et al., 2016). Fusion of diverse multiomics data was used for cancer subtyping (Liang et al., 2014) or survival prediction (Lai et al., 2020). Genomics data have been used in tandem with histology (Vale-Silva and Rohr, 2021) or mammogram (Yala et al., 2019) images for improved survival prediction. Guided fusion of different radiology modalities was used to improve segmentation of liver lesions (Mo et al., 2020) and anomalies in breast tissue (Lei et al., 2020). EMRs were used to guide feature extraction from dermoscopic (Zhou and Luo, 2021) and mammography (Vo et al., 2021) images to improve detection and classification of lesions. Chen et al. (Chen et al., 2021b) used genomics information to guide selection of histology features for improved survival prediction in multiple cancer types.
There is no conclusive evidence that one fusion type is ultimately better than the others, as each type is heavily data and task specific.
Multimodal interpretability
Interpretability and model introspection is a crucial component of AI development, deployment, and validation. With the ability of AI models to learn abstract feature representations, there is concern that the models might use spurious shortcuts for predictions, instead of learning clinically relevant aspects. Such models might fail to generalize when presented with new data or discriminate against certain populations (Banerjee et al., 2021; Chen et al., 2021a). On the other hand, the models can discover novel and clinical relevant insights. Here we present a brief overview of different methods used for model introspection in oncology (Figure 4), more technical details can be found in a recent review (Arrieta et al., 2020). It is worth indicating that these methods allow us to introspect parts of the data deemed important by the model in making predictive determinations yet the feature representation itself remains abstract.

Figure 4. Multimodal interpretability and introspection
(A and B) Histology: an MIL model was trained to classify subtypes of renal cell carcinoma in WSIs, while CNN was trained to perform the same task in image patches. (A) Attention heatmaps and patches with the lowest and highest attention scores. (B) GradCAM attributions for each class.
(C and E) Integrated gradient attributions can be used to analyze © genomics or (E) EMRs. The attribution magnitude corresponds to the importance of each feature, and direction indicates feature impact toward low (left) vs. high (right) risk. The color specifies the value of the input features: copy number gain and presence of mutation are shown in red, while blue is used for copy number loss and wild-type status. (E) Attention scores can be used to analyze the importance of words in the medical text.
(D and F) Radiology: an MIL model was trained to predict survival from MRI scans using axial slides as individual instances. (D) Attention heatmaps mapped into the 3D MRI scan and slides with the highest and lowest attention. (F) GradCAM was used to obtain pixel-level interpretability in each MRI slide. A 3D pixel-level interpretability is computed by weighting the slide-level GradCAM maps by the attention score of the respective slide.
Histopathology
In histopathology, VITs or MIL can reveal the relative importance of each image patch for the model predictions. Depending on the model architecture attention or probability scores can be mapped to obtain slide-level attention heatmaps as shown in Figure 4A, where an MIL model was trained to classify cancer subtypes in WSIs. Although no manual annotations were used, the model learned to identify morphology specific for each cancer type and to discriminate between normal and malignant tissues. Class activation methods (CAMs), such as GradCAM (Selvaraju et al., 2017) or GradCAM++ (Chattopadhay et al., 2018), allow one to determine the importance of the model inputs (e.g., pixels) by computing how the changes in the inputs affect the model outputs for each prediction class. GradCAM is often used in tandem with the guided-backpropagation method, the so-called guided-GradCAM (Selvaraju et al., 2016), where the guided backpropagation determines the pixel-level importance inside the predictive regions specified by the GradCAM. This is illustrated in Figure 4B, where a CNN was trained to classify cancer subtypes in image patches. For comparison, in the attention methods, the importance of each instance is determined during the training, while the CAM-based methods are model agnostic, i.e., independent of the model training.
Radiology
In radiology, the interpretability methods are similar to those used in histology. The attention scores can reflect the importance of slides in a 3D scan. For instance, in Figure 4D, an MIL model was trained to predict survival in glioma patients (Zhuang et al., 2022). The model considered the 3D MRI scan as a bag, where the axial slides are modeled as individual instances. Even in the absence of manual annotations, the model placed high attention to the slides with tumor, while low attention was assigned to healthy tissue. CAM-based methods can be consequently deployed to localize the predictive regions within individual slides (Figure 4F).
Molecular data
Molecular data can be analyzed by the integrated gradient method (Sundararajan et al., 2017), which computes attribution values indicating how changes in specific inputs affect the model outputs. For the regression tasks, such as survival analysis, the attribution values can reflect the magnitude of the importance as well as the direction of the impact: features with positive attribution increase the predicted output (i.e., higher risk), while features with negative attribution reduce the predictive values (i.e., lower risk). At the patient level, this is visualized as a bar plot, where the y axis corresponds to the specific features (ordered by their absolute attribution value) and the x axis shows the corresponding attribution values. At the population level, the attribution plots depict the distribution of the attribution scores across all subjects. Figure 4C shows the attribution plots for most important genomics features used for survival prediction in glioma patients (Chen et al., 2021c). Other tabular data, such as hand-crafted features or values obtained from EMR, can be interpreted in the same way. EMRs can be also analyzed by natural language processing (NLP) methods, such as transformers, where the attention scores determine the importance of specific words in the text (Figure 4E).
Multimodal models
In multimodal models, the attribution plots can also determine the contribution of each modality toward the model predictions. All previously mentioned methods can be used in multimodal models to explore interpretability within each modality. Moreover, shifts in feature importance under unimodal and multimodal settings can be investigated to analyze the impact of the multimodal context.
The interpretability methods usually come without any accuracy measures, and thus it is important not to overinterpret them. While CAM- or attention-based methods can localize the predictive regions, they cannot specify which features are relevant, i.e., they can explain where but not why. Moreover, there is no guarantee that all high-attention/attribution regions carry clinical relevance. High scores just mean that the model has considered these regions more important than others.
Multimodal data interconnection
The aim of multimodal data interconnection is to reveal associations and shared information across modalities. Such associations can provide new insights into cancer biology and guide the discovery of novel biomarkers. Although there are many approaches for data exploration, here we illustrate a few possible directions (Figure 5).
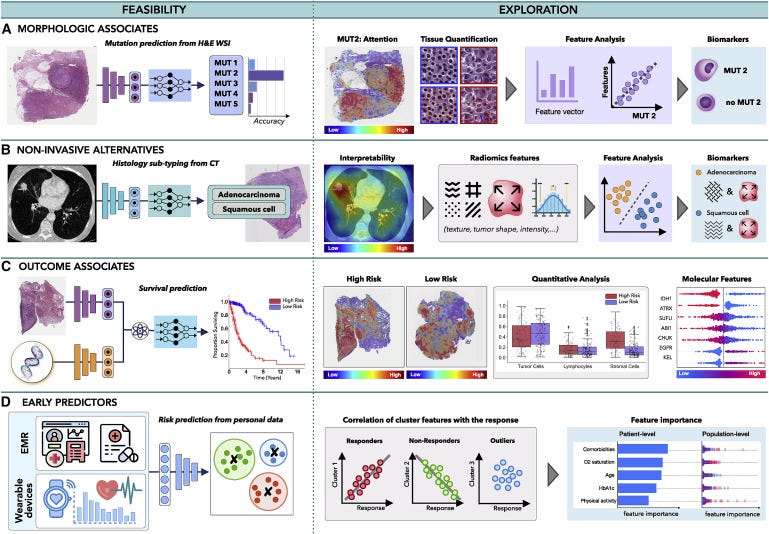
Figure 5. Multimodal data interconnection
(A and B) AI can identify associations across modalities, such as (A) the feasibility of inferring certain mutations from histology or radiology images or (B) the relation between non-invasive and invasive modalities, such as prediction of histology subtype from radiomics features.
© The models can uncover associations between clinical data and patient outcome, contributing to the discovery of predictive features within and across modalities.
(D) Information acquired by EMRs or wearable devices can be analyzed to identify risk factors related to cancer onset or uncover patterns related with treatment response or resistance, to support early interventions.
Morphologic associations
Malignant changes often propagate across different scales; oncogenic mutations can affect cell behavior, which in turn reshapes tissue morphology or the tumor microenvironment visible in histology images. Consequently, the microscopic changes might have an impact on tumor metabolic activity and macroscopic appearance detectable by PET or MRI scans. The feasibility of AI methods to identify associations across modalities was first demonstrated by Coudray et al. (Coudray et al., 2018), who showed that certain mutations in lung cancer can be inferred directly from hematoxylin and eosin (H&E)-stained WSIs. Other studies followed shortly, predicting the mutation status from WSIs in liver (Chen et al., 2020a), bladder (Loeffler et al., 2021), colorectal (Jang et al., 2020), and thyroid cancer (Tsou and Wu, 2019), as well as pan-cancer pan-mutation studies attempting to predict any genetic alternation in any tumor type (Fu et al., 2020; Kather et al., 2020). Additional molecular biomarkers, such as gene expression (Anand et al., 2020; Binder et al., 2021; Schmauch et al., 2020), hormone-receptor status (Naik et al., 2020), tumor mutational burden (Jain and Massoud, 2020), and microsatellite instability (Cao et al., 2020; Echle et al., 2020), have also been inferred from WSIs (Murchan et al., 2021). In radiology, AI models have predicted IDH mutation and 1p/19q co-deletion status from preoperative brain MRI scans (Bangalore Yogananda et al., 2020; Yogananda et al., 2020) and BRCA1 and BRCA2 mutational status from breast mammography (Ha et al., 2017) and MRI (Vasileiou et al., 2020) scans, while EGFR and KRAS mutations have been detected from CT scans in lung (Wang et al., 2019) and colorectal (He et al., 2020) cancer.
By discovering the presence of morphological associations across modalities, AI models can enhance exploratory studies and reduce the search space for possible biomarker candidates. For instance, in Figure 5A, AI has revealed that one of the studied mutations can be reliably inferred from WSI. Although the predictive features used by the model might be unknown, interpretability methods can provide additional insights. Attention heatmaps can reveal tissue regions relevant for the prediction of the specific mutation. Distinct tissue structures and cell types in the regions with the high- and low-attention scores can be identified, and their properties, such as nucleus shape or volume, can be further extracted and analyzed. Clustering or dimensionality reduction methods can be deployed to examine the promising features, potentially revealing associations between mutation status and distinct morphological features. The identified morphological associates can serve as cost-efficient biomarker surrogates to support screening in low- to middle-income settings or reveal new therapeutic targets.
Non-invasive alternatives
Similarly, AI can discover relationships between non-invasive and invasive modalities. For instance, AI models were used to predict histology subtypes or grades from radiomics features in lung (Sha et al., 2019), brain (Lasocki et al., 2015), liver (Brancato et al., 2022), and other cancers (Blüthgen et al., 2021). The predictive image regions can be further analyzed to identify textures and patterns with possible diagnostic values (see Figure 5B), which in turn can serve as non-invasive surrogates for existing biomarkers.
Outcome associates
Benefits of personalized medicine are often limited by the paucity of biomarkers able to explain dichotomies in patient outcomes. On the other hand, AI models are demonstrating great performance in predicting clinical outcomes, such as survival (Lai et al., 2020), treatment response (Echle et al., 2020), recurrence (Yamamoto et al., 2019), and radiation toxicity (Men et al., 2019), using unimodal and multimodal (Chen et al., 2020b, 2021c; Joo et al., 2021; Mobadersany et al., 2018) data. These works imply the feasibility of AI models to discover relevant prognostic patterns in data, which might be elucidated by interpretability methods. For instance, in Figure 5C, a model is trained to predict survival from histology and genomics data. Attention heatmaps reveal tissue regions related to low- and high-risk patient groups, while the molecular profiles are analyzed through attribution plots. The predictive tissue regions can be further analyzed by examining tissue morphology, cell subtypes, or other human-interpretable data characteristics. Tumor-infiltrating lymphocytes can be estimated through co-localization of tumor and immune cells to specify immune hot and cold tumors. Attribution of specific modalities as well as shifts in feature importance in unimodal vs. multimodal data can be explored to determine the influence of multimodal contextualization.
Such exploration studies have already provided new clinical insights. For instance, Geessink et al. (Geessink et al., 2019) showed that the tumor-to-stroma ratio can serve as an independent prognosticator in rectal cancer, while the ratio of tumor area to metastatic lymph node regions has prognostic value in gastric cancer (Wang et al., 2021). Other morphological features, such as the arrangement of collagen fibers in breast histology (Li et al., 2021) or spatial tissue organization in colorectal tissue (Qi et al., 2021), have been identified as possible biomarkers for aggressiveness or recurrence.
Early predictors
AI can also explore diverse data acquired prior to patient diagnosis to identify potential predictive risk factors. EMRs provide rich information on patient history, medication, allergies, or immunizations, which might contribute to patient outcome. Such diverse data can be efficiently analyzed by AI models to search for distinct patient subgroups (Figure 5D). Identified subgroups can be correlated with different patient outcomes, while attribution plots can identify the relevance of different factors at the patient and population level. Recently, Placido et al. (Placido et al., 2021) showed the feasibility of AI to identify patients with a higher risk of developing pancreatic cancer by exploration of EMR. Similarly, EMRs were used to predict treatment response (Chu et al., 2020) or length of hospital stay (Alsinglawi et al., 2022). The identified novel predictive risk factors can support large-scale population screenings and early preventive care.
Outside of the hospital setting, smartphones and wearable devices offer another great opportunity for real-time and continuous patient monitoring. Changes in the measured values, such as a decrease in patient step counts, have been shown as robust predictors of worse clinical outcome, and increased risk of hospitalization (Low, 2020). Furthermore, the modern wearable devices are continually expanding their functionality, including measurements of temperature, stress levels, or blood-oxygen saturation or electrocardiograms. These measurements can be analyzed in tandem with clinical data to search for risk factors indicating early stages of increased toxicity or treatment resistance, to allow personalized interventions during the course of treatment. Research on personalized monitoring and nanotechnologies is investigating novel directions, such as the detection of patient measurements in sweat (Xu et al., 2019) or ingestible sensors to monitor medication compliance and drug absorption (Weeks et al., 2018). All these novel devices provide useful insights into the patient state, which could be analyzed in a larger clinical context through AI models.
Challenges and clinical adoption
The path of AI into clinical practice is still laden with obstacles, many of which are amplified in the presence of multimodal data (Van der Laak et al., 2021). While several recent works discuss challenges, such as fairness and dataset shifts (Banerjee et al., 2021; Chen et al., 2021a; Cirillo et al., 2020; Howard et al., 2021; Mehrabi et al., 2021; Zhang et al., 2018), limited interpretability (Adebayo et al., 2018; Linardatos et al., 2020; Reyes et al., 2020), or regulatory guidelines (Cruz Rivera et al., 2020; Topol, 2020; Wu et al., 2021), here we focus on challenges specific to multimodal learning.
Missing data
The challenge of missing data refers to the absence of part of a modality or the complete unavailability of one or more modalities. The missing data affect both the model training and the deployment, since the majority of existing AI models cannot handle missing information. Moreover, the need to train models with complete multimodal data significantly constrains the size of the training datasets. Many multimodal datasets have large scale data missingness for example in the cancer genome atlas (TCGA) one of the largest publicly available multimodal datasets has significant missing data points. The incomplete modalities still contain valuable information, and the inability to deploy them poses a significant limitation. Below we discuss two strategies for handling missing data.
Synthetic data generation
Given the paucity of medical data in general synthetic data is increasingly being used to train, develop and augment AI models (Chen et al., 2021). If part of an image is corrupted, or if specific mutations are not reported, the missing information can be synthesized from the remaining data. If a whole modality is missing, its synthetic version can be derived from existing similar modalities. For instance, de Haan et al. (de Haan et al., 2021) trained a supervised model for translation of H&E stains into special stains, using the special stains as ground truth labels. The model was trained on pairs of perfectly aligned data obtained through re-staining of the same slides. If paired data are not available, unsupervised methods such as cycle generative adversarial networks (GANs) (Zhu et al., 2017) can be used. While synthetic data can improve the performance of detection and classification methods, they are less suitable for outcome prediction or biomarker exploration, where the predictive features are not well understood and thus there is no guarantee that the synthetic data contain the relevant disease characteristics. Moreover, the algorithms can also hallucinate malignant features into the supposedly normal synthetic images (Cohen et al., 2018), which can further hurt prediction results.
Dropout-based methods
Dropout-based methods aim to make models robust to missing information. For instance, Choi and Lee (Choi and Lee, 2019) proposed the EmbraceNet model, which can handle incomplete or missing data during training and deployment. The EmbraceNet model probabilistically selects partial information from each modality and combines it into a single representation vector, which then serves as an input for the final decision model. When missing or invalid data are encountered, they are not sampled; instead, other more complete modalities are used to compensate for the missing data. The probabilistic data selection also has a regularization effect, similar to the dropout mechanism.
Data alignment
To investigate cancer processes across different scales and modalities, a certain level of data alignment is required. This might include alignment of (1) similar or (2) diverse modalities.
Alignment of similar modalities
This method typically involves different imaging modalities of the same system. This is usually achieved through image registration, which is formulated as an optimization problem minimizing the difference between the modalities.
In radiology, rigid anatomical structures can guide the data alignment. For instance, registration of MRI and PET brain scans is usually achieved with high accuracy, even with simple affine registration, thanks to the rigid skull. The situation is more complex in the presence of motion and deformations, e.g., breathing in lung imaging or changes in the body posture between scanning sessions. Alignment of such data usually requires deformable registrations using natural or manually placed landmarks for guidance. A particularly challenging situation is the registration of scans between interventions, e.g., registration of preoperative and postoperative scans, which exhibit lot of non-trivial changes due to tumor resection, response to treatment, or tissue compression (Haskins et al., 2020).
In histology, each stained slide usually comes from a different tissue cut. Even in consecutive tissue cuts there are substantial differences in the tissue appearance caused by changes in the tissue microenvironment or artifacts such as tissue folding, tearing, or cutting (Taqi et al., 2018), which all complicate data alignment. Robust and automated registration of histology images can be challenging (Borovec et al., 2020), and thus many studies deploy non-algorithmic strategies such as clearing and re-staining of the tissue slides (Hinton et al., 2019). A newly emerging direction is stainless imaging, including approaches such as ultraviolet microscopy (Fereidouni et al., 2017), stimulated Raman histology (Hollon et al., 2020), or colorimetric imaging (Balaur et al., 2021).
Alignment of diverse modalities
This refers to the integration of data from different scales, time points, or measurements. Often an acquisition of one modality results in the destruction of the sample, preventing collection of multiple measurements from the same system. For instance, most omics measurements require tissue disintegration, which inevitably affects the possibility of studying relations between cell appearance and corresponding gene expression. Here, cross-modal autoencoders can be used to enable integration and translation between arbitrary modalities. Cross-modal autoencoders (Dai Yang et al., 2021) build a pair of encoder-decoder networks for each modality, where the encoder maps each modality into a lower-dimensional latent space, while the decoder maps it back into the original space. A discriminative objective function is used to match the different modalities in the common latent space. With the shared latent space in place, one can combine an encoder of one modality with the decoder of another modality to align one modality to another one. Dai Yang et al. (2021) demonstrated translations between single-cell chromatin images and RNA-sequencing data. The feasibility and utility of the cross-modal autoencoders are yet to be tested with large scale clinically relevent datasets. However, if proven potent, they hold great potential to address challenges with alignment and harmonization of data from diverse sources.
Transparency and prospective clinical trials
Given the complexity of representation learning-based modern AI methods and the fact that they use abstract feature representations, it is possible that their mechanisms will not be fully understood in the near future. However, one may argue that many aspects in medicine are not fully understood, either (Kirkpatrick, 2005). Some of the interpretability methods discussed earlier are capable of indicating regions within data used to make prediction determination yet the actual feature representation remains abstract. And thus, rather than dwelling on the full opacity of AI methods, we should advocate for their rigorous validation under randomized clinical trials, same as is done for other medical devices and drugs (Ghassemi et al., 2021) . Prospective trials will allow us to stress test the models under real-world conditions, compare their performance against standard-of-care and current practice, estimate how clinicians will interact with the AI tool, and find the best way in which the models can enhance, rather than disturb, the clinical workflow. In the case of biomarker surrogates discovered by AI methods, regulation paths similar to “me-too” drugs and devices (Aronson and Green, 2020) could be used to ensure comparable levels of performance. Transparency about study design and the data used are necessary to determine the intended use and conditions under which the model performance has been verified and evaluated (Haibe-Kains et al., 2020). Prospective clinical trials are inevitable to truly demonstrate and quantify the added value of AI models, which will in turn increase trust and motivation of practitioners toward the AI tools.
Outlook and discussion
AI has the potential to have an impact on the whole landscape of oncology, ranging from prevention to intervention. AI models can explore complex and diverse data to identify factors related to high risks of developing cancer to support large population screenings and preventive care. The models can further reveal associations across modalities to help identify diagnostic or prognostic biomarkers from easily accessible data to improve patient risk stratification or selection for clinical trials. In a similar way, the models can identify non-invasive alternatives to existing biomarkers to minimize invasive procedures. Prognostic models can predict risk factors or adverse treatment outcomes prior to interventions to guide patient management. Information acquired from personal wearable devices or nanotechnologies could be further analyzed by AI models to search for early signs of treatment toxicity or resistance, with other great application yet to come.
As with any great medical advance, there is a need for rigorous validation and examination via clinical studies, prospective trials to verify the promises made by AI models. The role of AI in advancing the field of oncology is not autonomous; rather, it is a partnership between models and human experience that will drive further progress. AI models come with limitations and challenges; however, these should not intimidate but rather inspire us. With increasing incidence rates of cancer, it is our obligation to capitalize on benefits offered by AI methods to accelerate discovery and translation of advances into clinical practice to serve patients and health care providers.
Acknowledgments
This work was supported in part by the BWH President’s Fund, National Institute of General Medical Sciences (NIGMS) R35GM138216 (to F.M.), Google Cloud Research Grant, Nvidia GPU Grant Program, and internal funds from BWH and MGH Pathology. M.Y.L. was additionally supported by the Tau Beta Pi Fellowship and the Siebel Foundation. T.Y.C. was additionally supported by the NIH National Cancer Institute (NCI) Ruth L. Kirschstein National Service Award, T32CA251062. R.J.C. was additionally supported by the National Science Foundation (NSF) graduate fellowship. The content is solely the responsibility of the authors and does not reflect the official views of the NIH, NSF, NCI or NIGMS.
References and additional information:
See the original publication
Originally published at https://www.cell.com.
About the authors & affiliations:
Jana Lipkova,1,2,3,4
Richard J. Chen,1,2,3,4,5
Bowen Chen,1,2,8
Ming Y. Lu,1,2,3,4,7
Matteo Barbieri,1
Daniel Shao,1,2,6
Anurag J. Vaidya,1,2,6
Chengkuan Chen,1,2,3,4
Luoting Zhuang,1,3
Drew F.K. Williamson,1,2,3,4
Muhammad Shaban,1,2,3,4
Tiffany Y. Chen,1,2,3,4 and
Faisal Mahmood1,2,3,4,9, *
1 Department of Pathology,
Brigham and Women’s Hospital, Harvard Medical School, Boston, MA, USA
2Department of Pathology,
Massachusetts General Hospital, Harvard Medical School, Boston, MA, USA
3Cancer Program,
Broad Institute of Harvard and MIT, Cambridge, MA, USA
4Data Science Program,
Dana-Farber Cancer Institute, Boston, MA, USA
5Department of Biomedical Informatics,
Harvard Medical School, Boston, MA, USA
6 Harvard-MIT Health Sciences and Technology (HST), Cambridge, MA, USA
7Department of Electrical Engineering and Computer Science, Massachusetts Institute of Technology (MIT), Cambridge, MA, USA
8Department of Computer Science,
Harvard University, Cambridge, MA, USA
9 Harvard Data Science Initiative,
Harvard University, Cambridge, MA, USA