


the health tech institute
research and strategy institute
Joaquim Cardoso MSc
Chief Researcher & Editor of the Site
April 5, 2023

SOURCE:
How to scale a health tech business to $100 million ARR and beyond
After studying over 100 venture-backed healthcare companies, we present the definitive benchmarks for what growing a health tech business should look like at every stage.
Bessemer Venture Partners (BVP)
BY SOFIA GUERRA AND STEVE KRAUS
April 5, 2023
As multi-stage healthcare investors at Bessemer, portfolio companies and prospects often ask us: “What milestones should my company reach before our next fundraising round? How fast should we be growing? What do you consider great unit economics? How have the benchmarks changed over the last few years as investors push for efficiency over growth at all costs?”
To scale an efficient and enduring health tech business, it is critical to measure the operational, financial, and clinical performance metrics.
This is especially important in the current environment: the cost of capital has increased, and macroeconomic headwinds have made investors skittish about investing in cash-flow-negative businesses. At Bessemer, we defined eight essential performance metrics for health tech businesses , as well as the key differences between the two primary health tech business models , healthcare SaaS, and tech-enabled services. As a continuation of that work, we have now quantified the performance of over 100 health tech companies to further analyze the best-in-class metrics for each business model and how each metric changes across different stages of growth.
The goal of our research is to equip you- healthcare founders, CEOs, CFOs, and operators-with the best data to inform scaling decisions for your businesses.
It is crucial to understand what best-in-class looks like for your specific business and strive to be in the top quartile of performers. Most importantly, healthcare leaders need to understand the nuances of their business and metrics to be able to explain drivers of historical performance and future growth.
We hope that our work serves as the blueprint for the health tech industry on how to scale efficient and enduring businesses to $100 million in revenue run-rate and beyond.
LESSONS
Lesson #1: Healthcare innovation takes time
Lesson #2: Your margin, your opportunity
Lesson #3: nurture your customer relationships
Lesson #4: A love note to efficiency
Lesson #5: TLDR; Manage cash and plan your way to the next milestone
Lesson #1: Healthcare innovation takes time
At Bessemer, we have always believed that building in healthcare is not for the faint of heart.
Achieving scaled innovation in the healthcare system requires patience and time. We wondered how long it takes for healthcare SaaS and tech-enabled services businesses to get to $10 million or $100 million in ARR, and whether the fast growth expectations of venture capitalists are a good match for the reality of innovating in healthcare.
Please note, here and throughout the report, when we refer to tech-enabled services ARR, we are referring to annualized revenue run-rate, which is often re-occurring in nature.
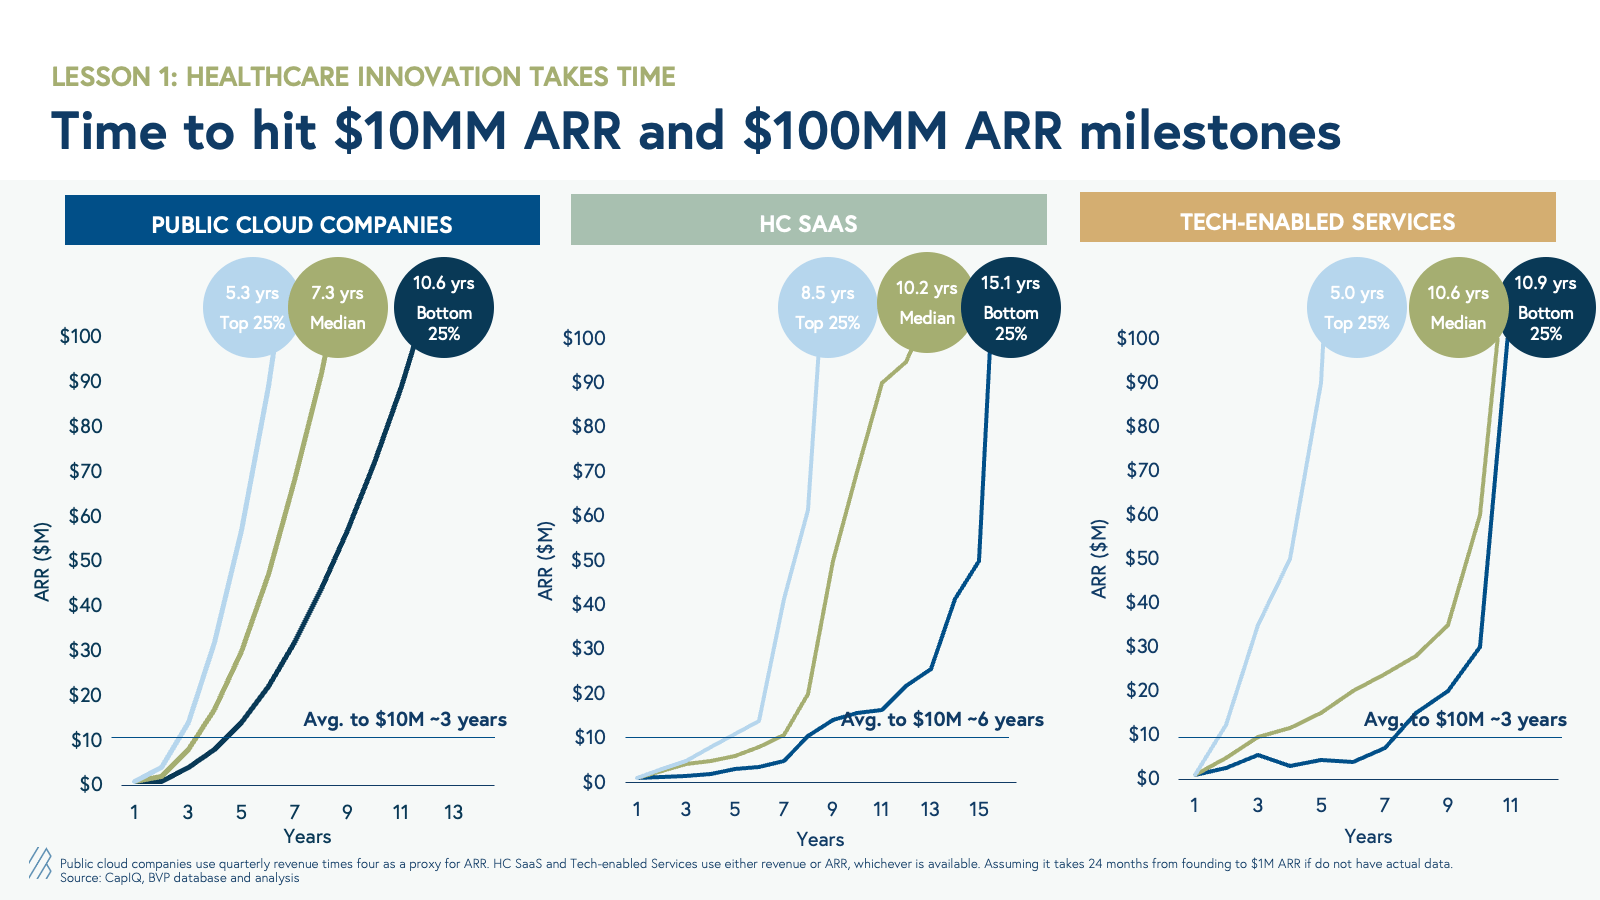
For the median health tech business, it takes roughly 10–11 years to reach $100 million in ARR, which is over three to four years longer than their cloud counterparts.
However, on average, tech-enabled services businesses scale as fast as cloud businesses to $10 million ARR in three years, whereas healthcare SaaS businesses take much longer to hit $10 million ARR, in 6 years.
There are stark differences between the top- and bottom-quartile performers in healthcare SaaS and tech-enabled services:
- For tech-enabled services, top-quartile performers scale to $10 million of ARR in less than 2 years and $100 million of ARR at around five years, which is faster than top-quartile cloud companies. Examples of public tech-enabled services companies in this cohort are Hims & Hers, LifeStance Health, and R1.
- For healthcare SaaS, top performers take roughly 5.5 years to reach $10 million of ARR, and 8.5 years to reach $100 million of ARR, longer than cloud and tech-enabled services businesses. We hypothesize that this is driven by compliance requirements, longer sales cycles, integrations and customizations, and implementation cycles required for healthcare SaaS products.
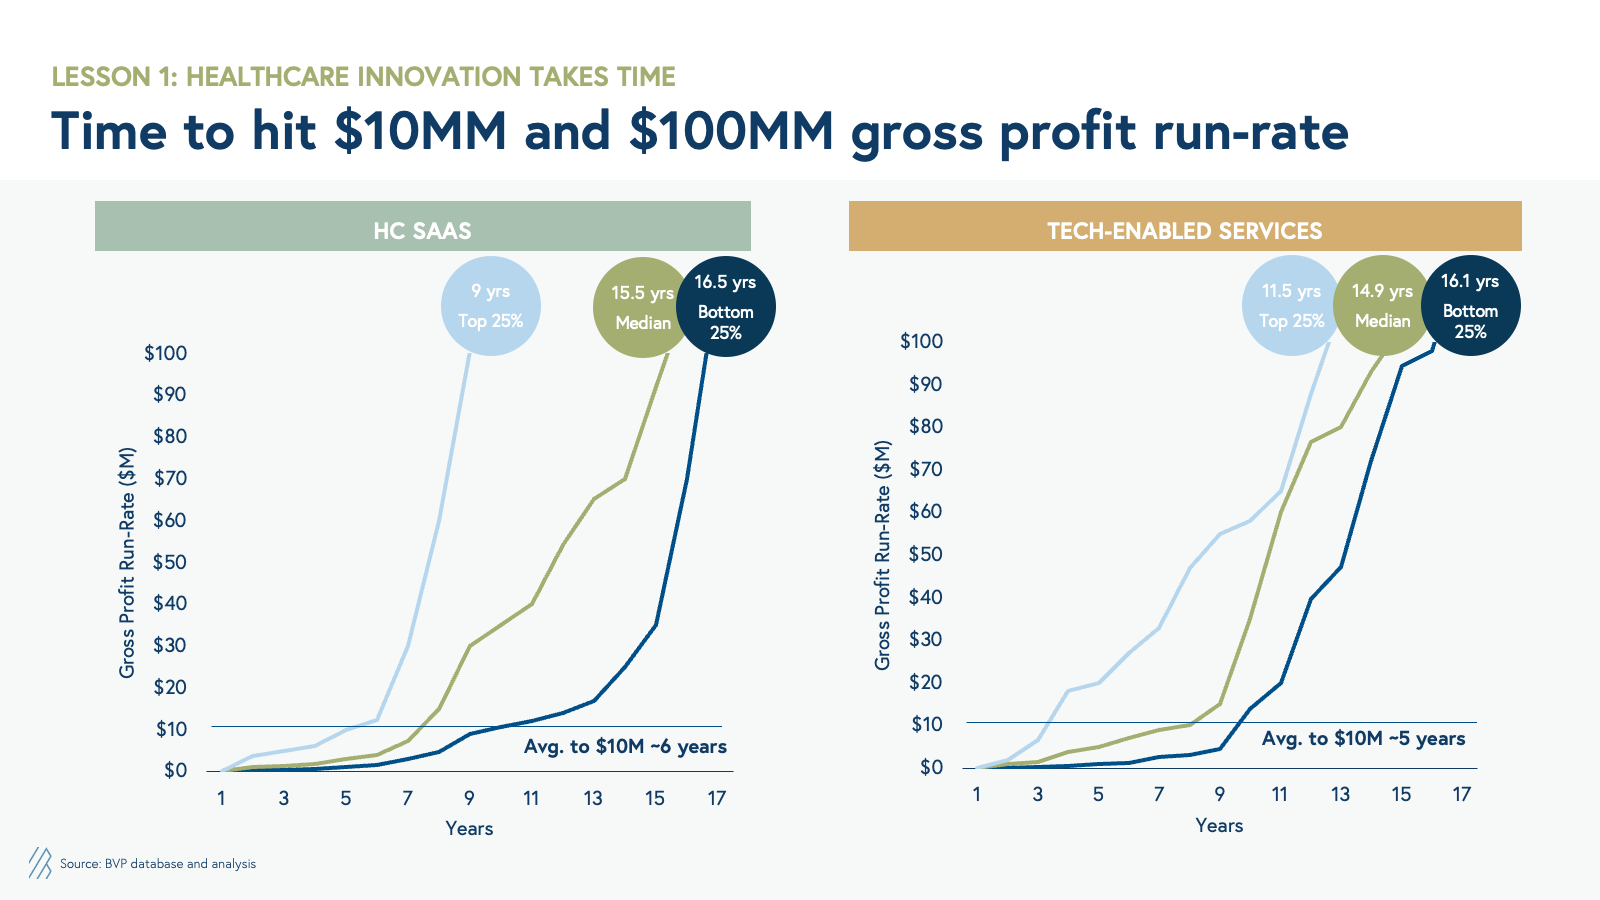
It is important to note that not all revenue is created equal for tech-enabled services businesses, given differences in gross margins.
Therefore, revenue growth may not be the ultimate goal in this category.
If we adjust to review these milestones for gross profit run-rate, we see a very similar timeline to get to $10 million and $100 million gross profit run-rate across both healthcare SaaS and tech-enabled services.
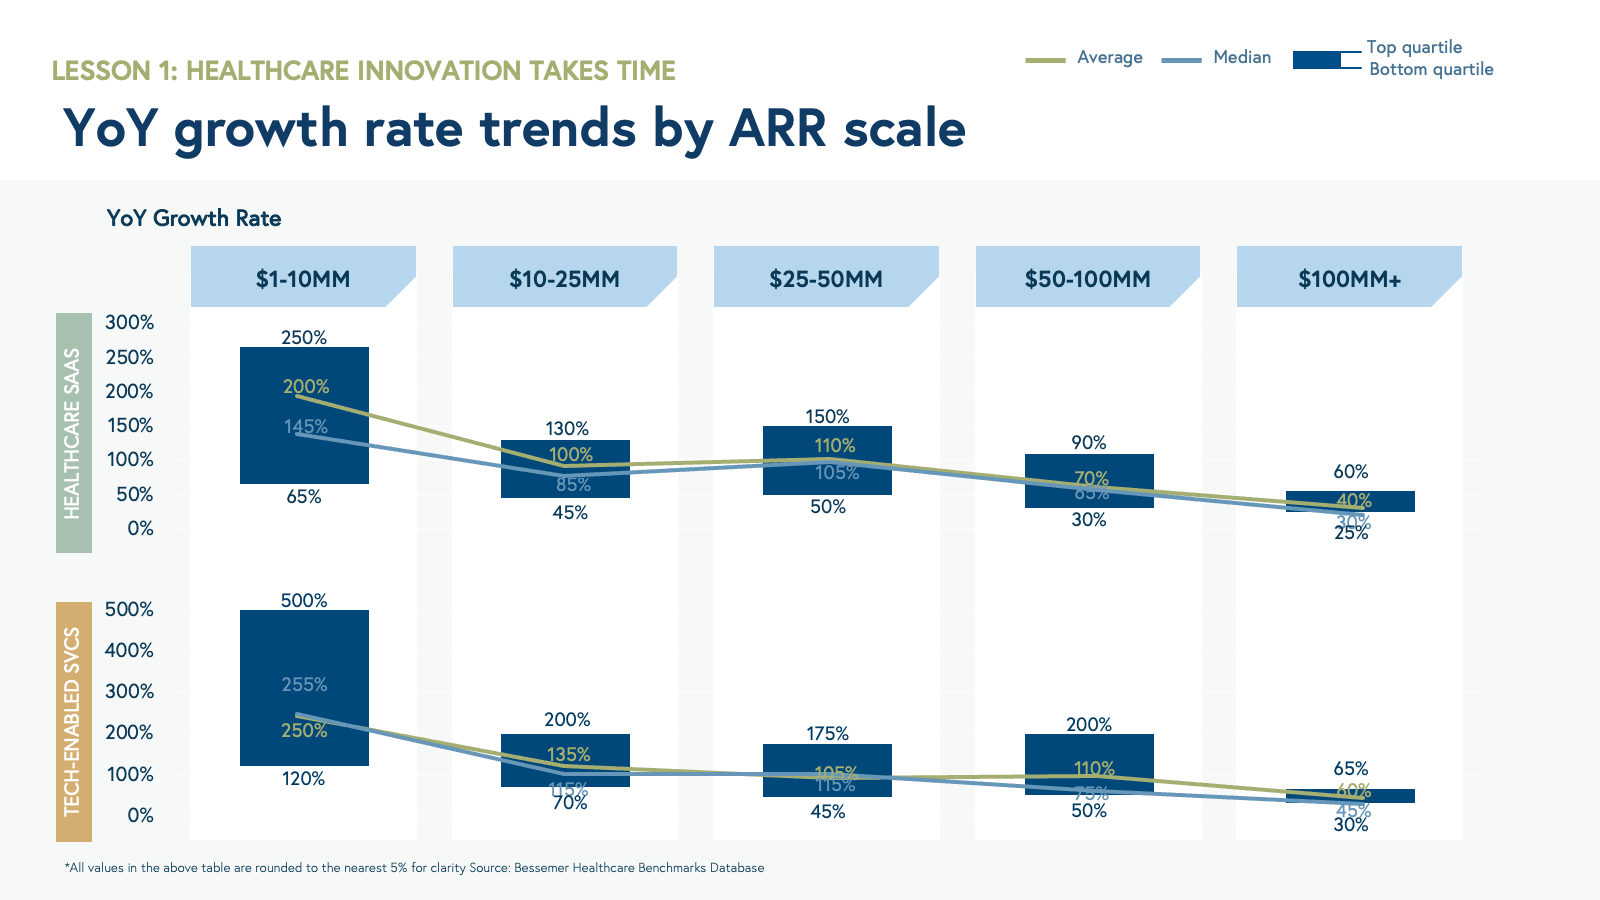
ARR growth rate
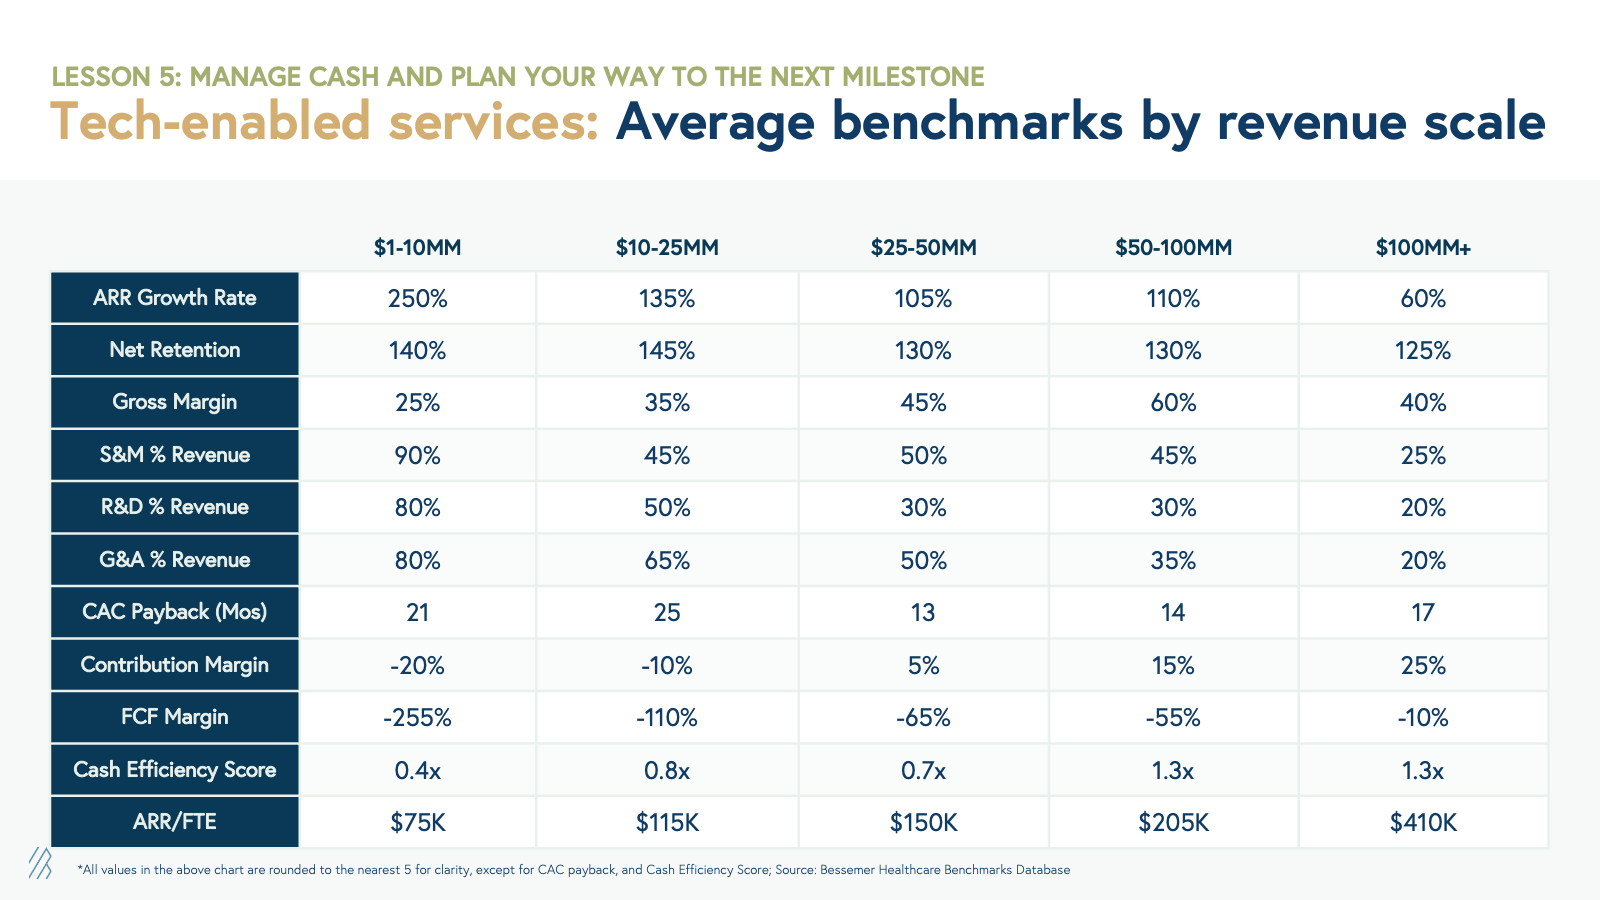
To understand how growth changes at each stage, we broke out year-over-year growth rates across ARR scale buckets after businesses reach $1 million ARR. At $1 million to $10 million ARR, we see fast growth of >200% in both categories, but as companies scale to subsequent buckets, we see a slowdown in year-over-year growth. Tech-enabled services maintain a faster growth rate at every stage as they scale to over $100 million ARR compared to healthcare SaaS.
TAM penetration
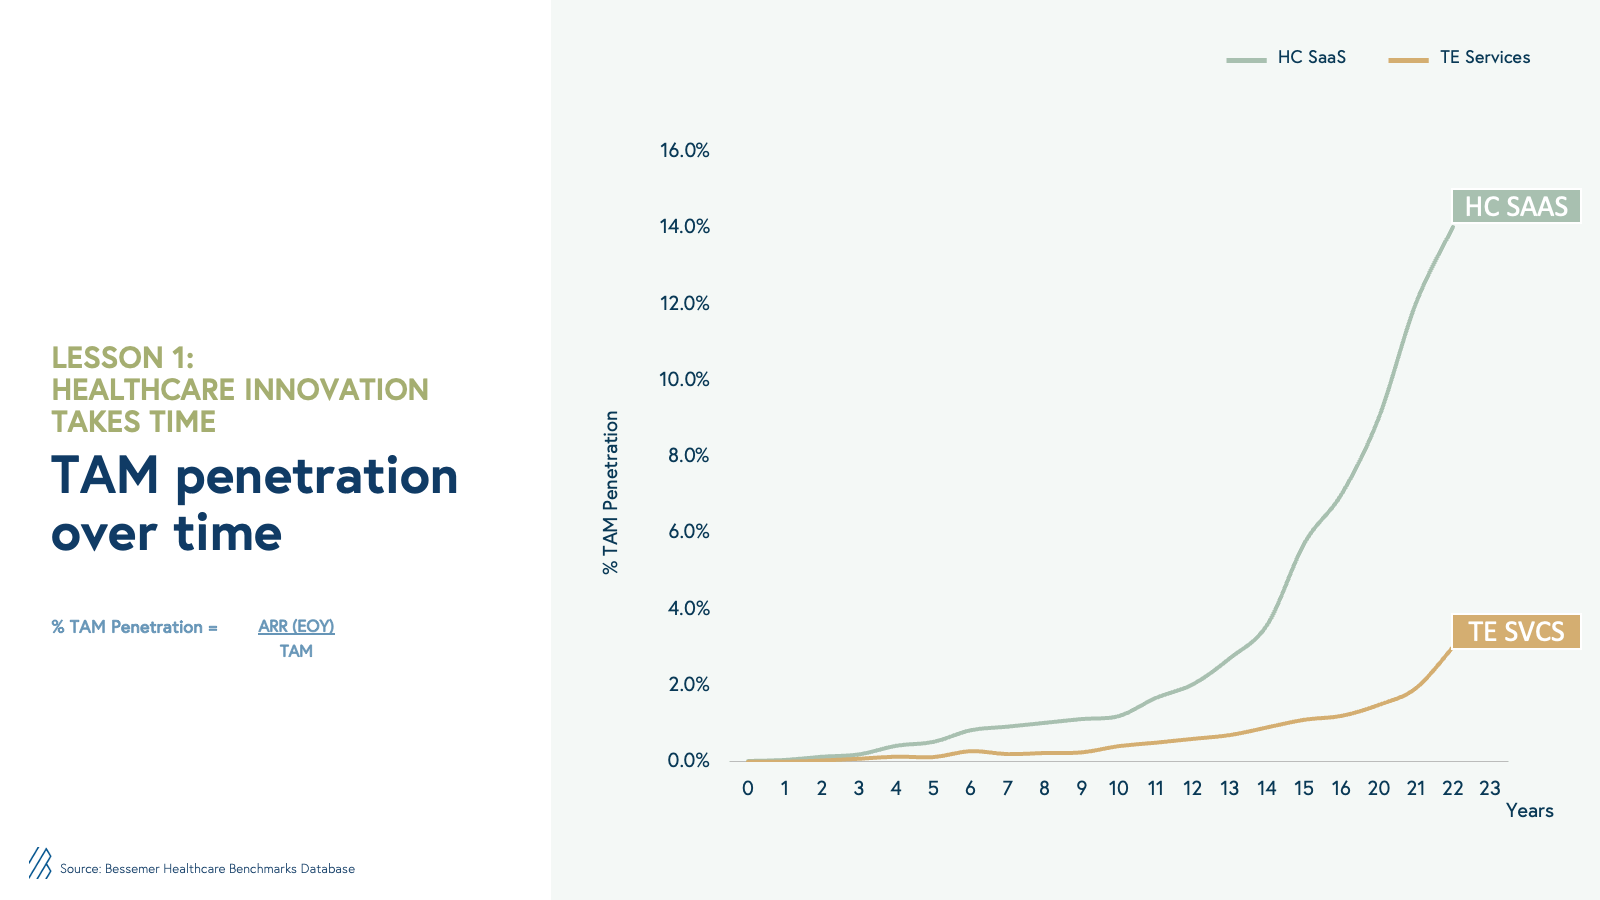
In our first benchmarks report , we hypothesized that total addressable market (TAM) sizes are a key factor in determining how tech-enabled services can scale faster than healthcare SaaS businesses. TAM penetration is one such metric that helps companies understand their market share based on their ARR. (To calculate TAM penetration, % TAM penetration = ARR (EOY) / by TAM size.) TAM penetration over time shows that tech-enabled services have more room to grow, even after reaching $100 million ARR, as they capture a small portion of the market with less than a couple of percentage points penetration. Therefore, Healthcare SaaS companies, which are inherently vertical SaaS businesses , need to own a higher market share to reach a similar scale.
Lesson #2: Your margin, your opportunity
While rapidly scaling revenue is essential for venture-backed health tech businesses, it is equally important to understand the underlying capital requirements to scale those businesses. In our Benchmarks for Growing Health Tech Businesses , we discussed how different business models in health tech have fundamentally different unit economics. Despite those differences, businesses that reach a $100 million scale, across both tech-enabled services and healthcare SaaS, show equally attractive Free Cash Flow margins as their cloud counterparts.
Gross margins
In the current macro environment, investors are placing gross margins under a microscope as they recognize the critical role they play in determining a company’s longer-term profitability. By analyzing gross margins, investors can evaluate a business’ pricing power, cost management, and overall scalability of the business model, which ultimately impacts the bottom line and ability to withstand market pressures. Gross margins measure how effectively companies deliver their software or tech-enabled services to their customers.
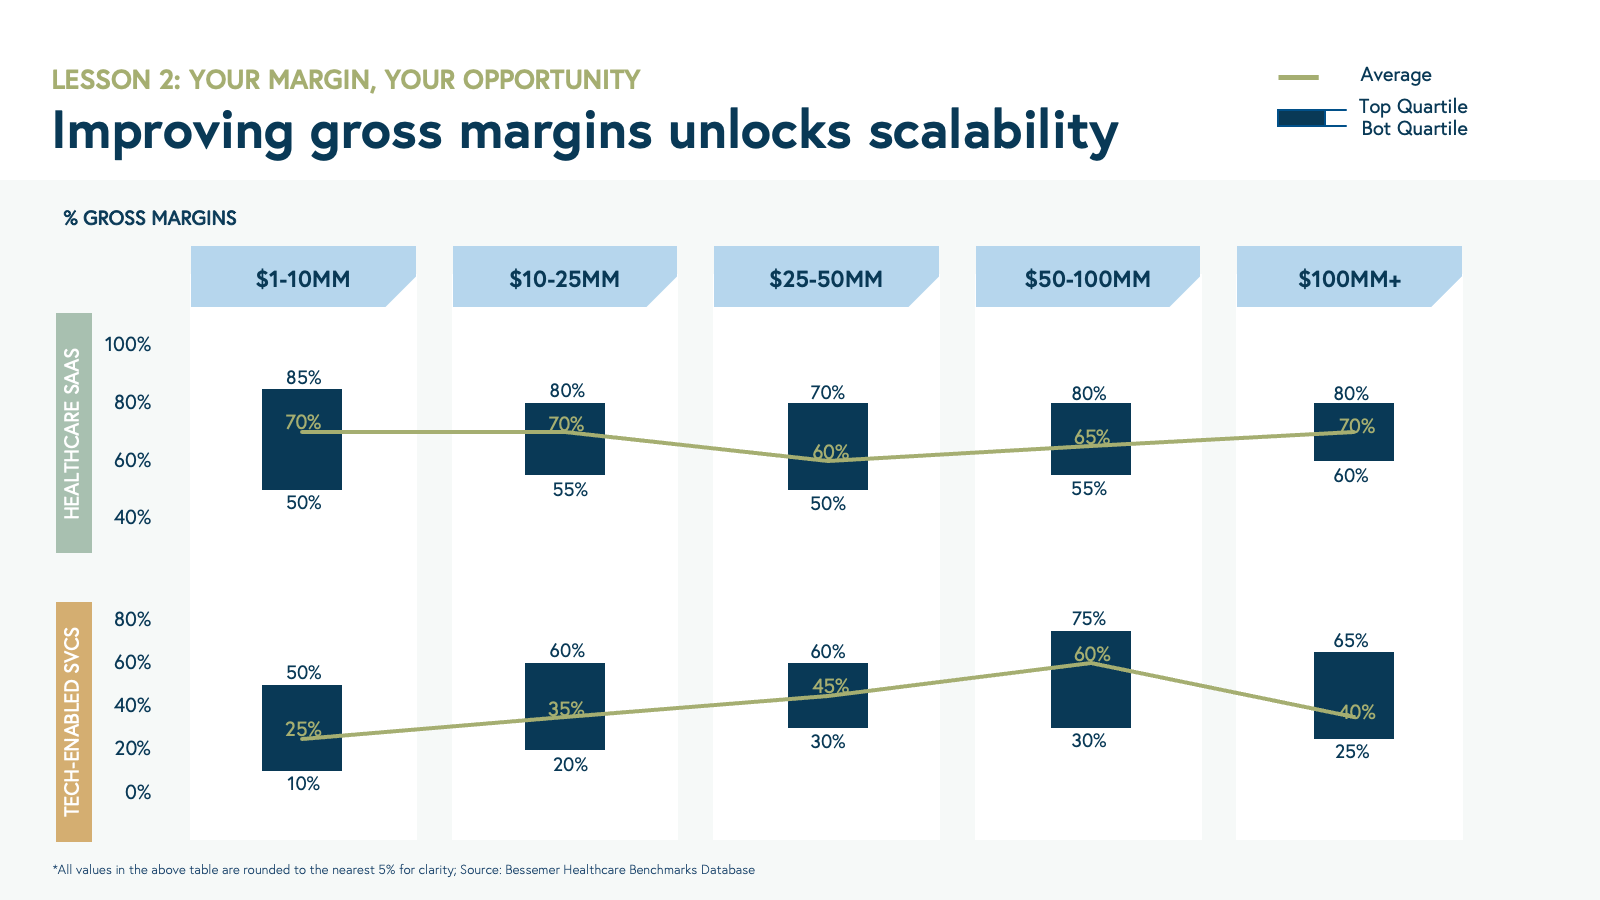
Like cloud companies, healthcare SaaS businesses have a fairly narrow band for delivering their software to healthcare customers, with an average gross margin across stages between 65–70%.
However, for companies between $1 million to $10 million of ARR, we see that there is a wider range of gross margins between top- and bottom-quartile performers, where bottom-quartile performers have a gross margin of 50% and top-quartile performers have a gross margin of ≥85%.
Many early-stage healthcare SaaS companies utilize services during implementation and client support to bolster offerings and drive stakeholder alignment, change management, and adoption.
Over time, healthcare SaaS companies are able to improve gross margins as they complete customer implementations, standardize processes, and benefit from economies of scale.
A great example of this approach is Veeva, the darling of pharma tech and vertical SaaS. Today, Veeva has >$2 billion ARR and >70% gross margins. However, over ten years ago, Veeva had <$50M ARR and ~55% gross margins.
Though tech-enabled services require more time and thus are much more challenging to scale than SaaS, high gross margins can still be achieved over time.
Thus, gross profit should be your north star. Our research shows that for tech-enabled services businesses with $1 million to $10 million of run-rate revenue, gross margins are, on average, 25%.
In subsequent stages, these businesses can achieve stepwise improvement to 35% gross margins with a scale of $10 million to $25 million ARR, 45% gross margins for $25 million to 50 million, and >60% for $50 million to $100 million.
For tech-enabled services businesses with over $100 million ARR, we see an average gross margin of 40%.
As tech-enabled services scale beyond $100 million ARR, they tend to take risk to 1) access a much larger TAM as discussed in Lesson #1 and 2) have a better ability to impact financial and clinical ROI (i.e., bend the cost curve).
The decision to take on risk comes at a tradeoff with unit economics, and thus we see the average gross margins are lower for these value-based care (VBC) businesses, which we will discuss in another article.
Still, the top-quartile tech-enabled services businesses with over $100 million of ARR have gross margins over 65%, including firms such as Livongo, Teladoc, and BVP portfolio company Headspace Health.
This steady progression from 25% gross margins to over 60% is driven by several factors:
- The ability to command a higher service price over time with strong clinical outcomes and well-defined financial ROI for your customers.
- Leveraging technology that enables clinicians to provide better care and omnichannel member experiences.
- Managing more efficient provider panels (i.e., increasing the number of patients per provider over time) with better processes and technology, as well as utilizing different types of providers operating at top of the license (i.e., coaches, nurse practitioners).
All of these levers impact clinical quality and outcomes, requiring a delicate balance between technology deployment and robust clinical efficacy to improve care delivery.
Operating expenses (OpEx)
Companies that improve unit economics as they scale are best positioned to control their own destiny over time, reaching break-even and growing self-sustaining cash flows.
That’s why it’s crucial to examine the breakdown of gross profit dollar spend and evaluate the return on investment for operating expenses.
By doing so, your company can achieve operating leverage over time, with the ultimate goal of increasing operating income and generating free cash flows.
As you can see in the graph below, the percentage spent on each OpEx category declines as a health tech company grows, unlocking economies of scale for your business.
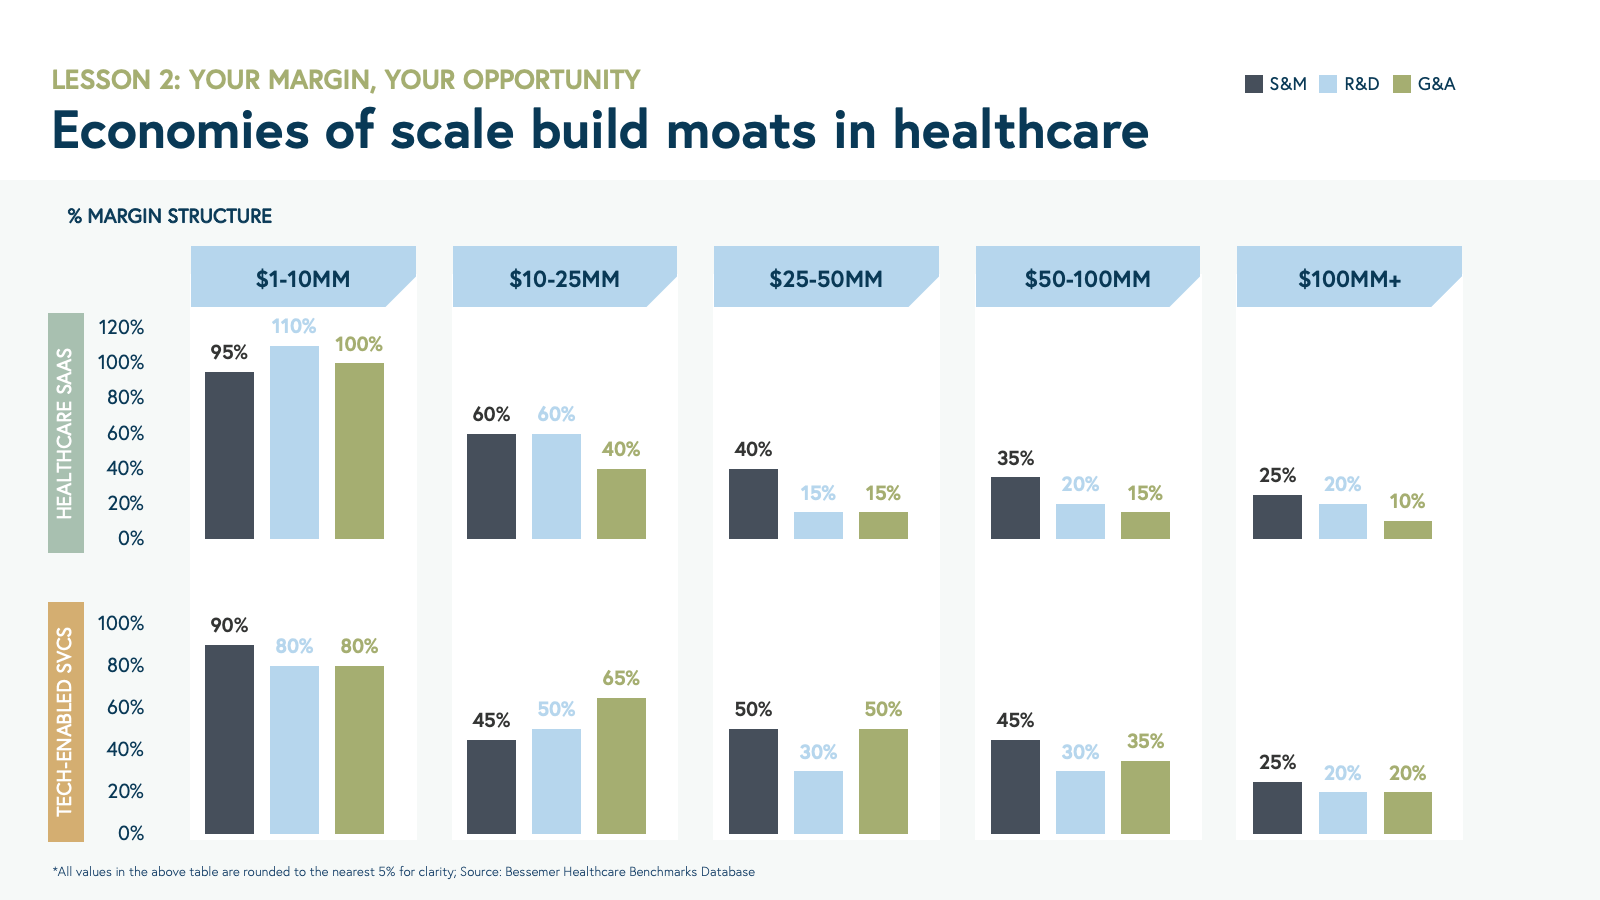
Here’s what we’ve found on three key OpEx categories: research and development, sales and marketing, and general and administrative expenses.
- Research and Development (R&D): Core investments in product and engineering innovations often enable healthcare SaaS businesses to develop better products for their customers. R&D is the most significant expense below the gross profit line at the early stages, but it declines to ~20% by $100M ARR and beyond. Conversely, for tech-enabled services businesses, R&D is deployed towards developing better workflow tools to standardize the services delivered and provide better customer experiences and outcomes. R&D investment will also help reduce COGS (see more in the gross margin section).
- Sales and Marketing (S&M): S&M is perhaps the most important operating expense as it directly translates to sales by impacting demand generation, customer acquisition, and client success. It’s generally a variable cost, including marketing, sales compensation, and commissions. Because of this, we would have expected S&M to scale linearly with revenue growth. However, in health tech businesses, we found that S&M as a % of revenue declines as a company scales. In healthcare, regardless of SaaS or tech-enabled services, sales cycles are long, with enterprise-like go-to-market motions. Often this is driven by compliance requirements, bespoke integrations, multiple stakeholders, and the need to prove strong financial ROI. However, over time health tech businesses can unlock flywheel effects for nurturing their customers and drive S&M % of revenue down.
- General and Administrative (G&A): This expense line generally includes all back office functions like executive leadership, legal, finance, and HR. While you need to invest upfront in hiring great executives and back-office personnel, these expenses generally won’t scale in line with sales or gross profit, and end up being a small portion of your OpEx over time.
Free cash flow margin and cash efficiency score
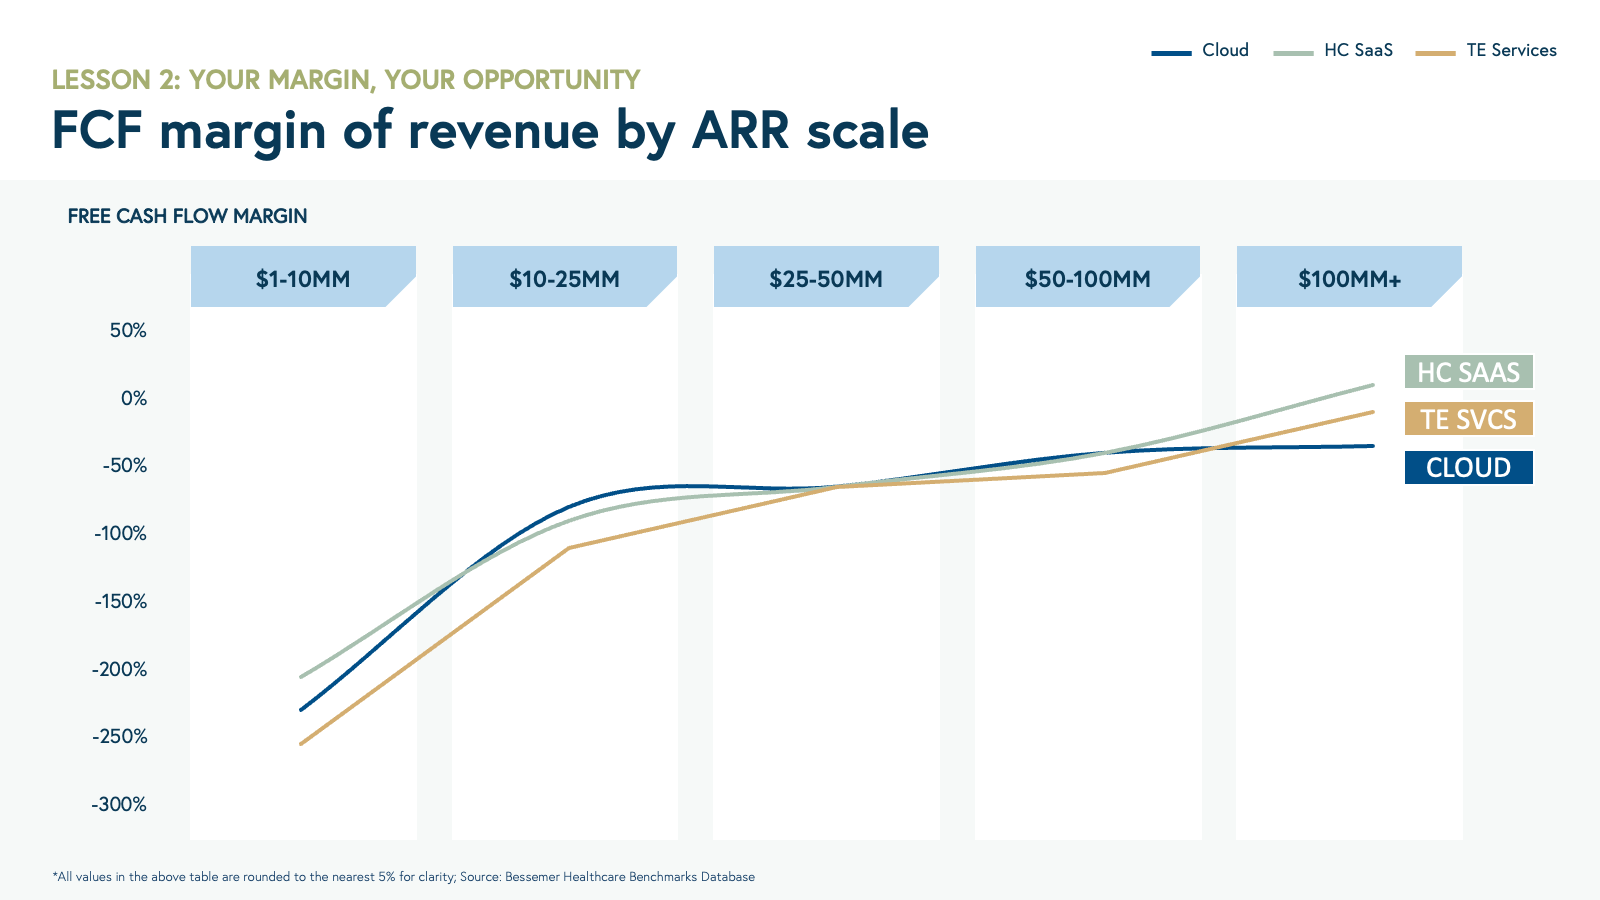
Cash is the lifeline of any business, and cash management, especially in the early days, is critical. Understanding cash flow margin and burn rate is crucial as you evaluate future investments, runway, and milestones for your next financing. As a health tech company grows, the goal is to flip a negative FCF margin and burn rate into a positive one and start generating free cash flow. However, there is a trade-off between profitability and growth rate.
In the current market environment, growth is no longer the only driver of valuation. It’s important to find a good balance between net new ARR growth and burn rate by understanding the tradeoffs of investment decisions and the timelines to see returns that unlock a >1x multiple on invested capital.
Growing a health tech business requires more time and capital relative to more conventional cloud businesses. That’s driven in part by long sales cycles and investments to prove outcomes of healthcare products and services, as well as time spent building relationships and alignment across multiple stakeholders. However, our study shows that over time, healthcare SaaS and tech-enabled services follow an improvement of FCF margin similar to that of cloud companies, and, once at scale, can have more attractive margins.
Lesson #3: Nurture your customer relationships
Retention is your best friend: net dollar revenue retention (NDRR)
Nurturing your early adopters pays dividends. In healthcare, we see that your ability to land and expand an account drives a very high proportion of revenue growth. This is seen in the high net dollar revenue retention (NDRR) values across healthcare SaaS and tech-enabled services.
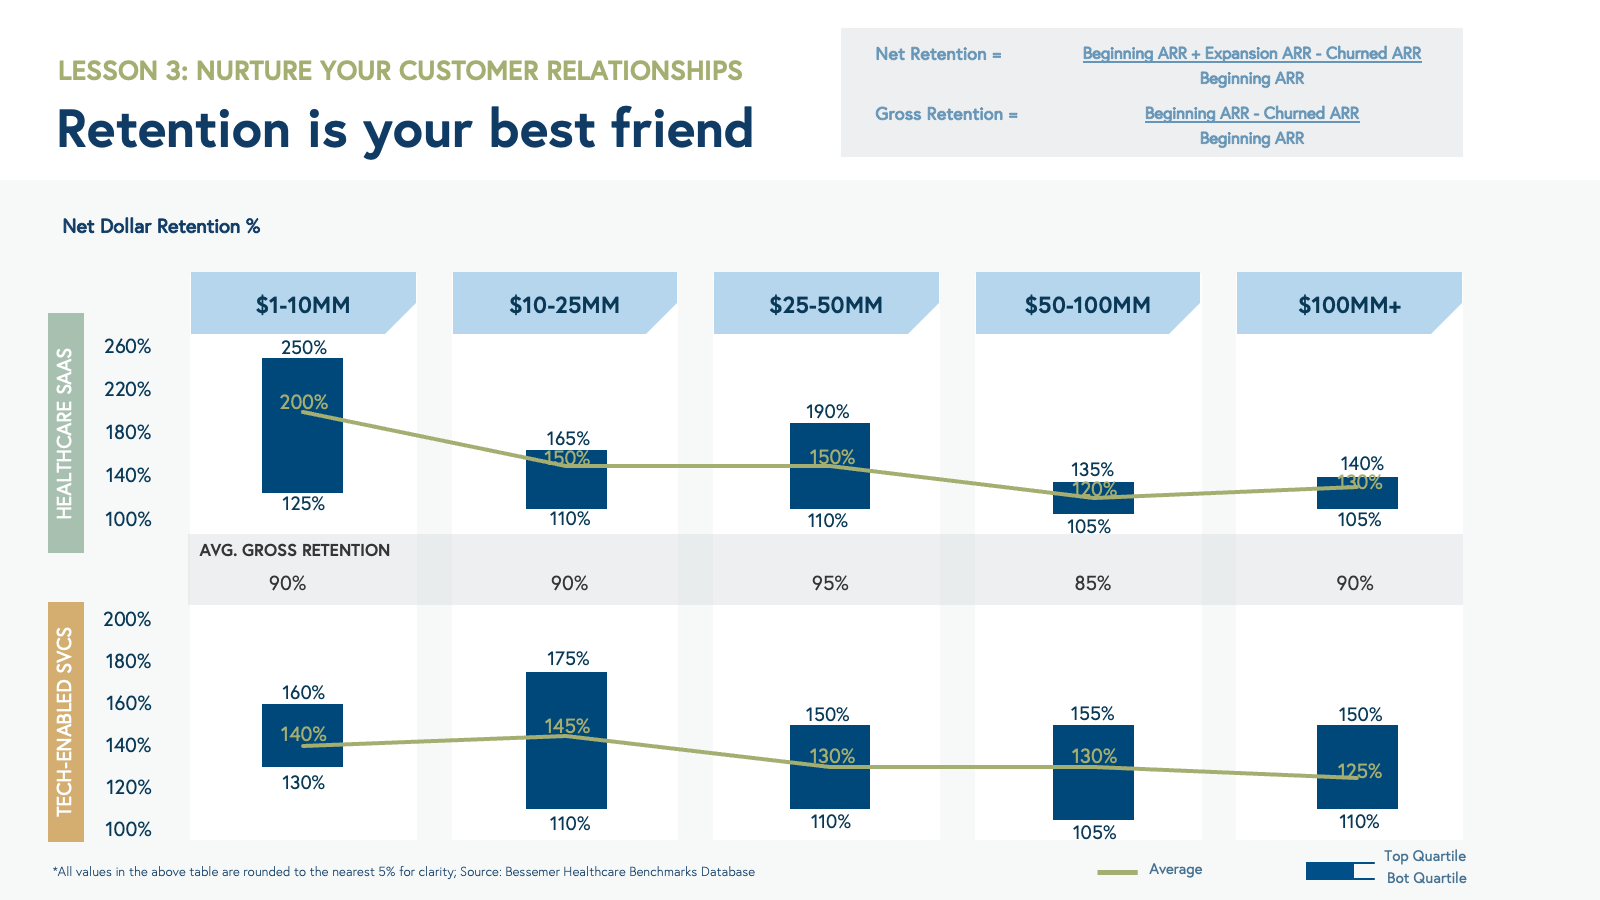
In healthcare SaaS, a high NDRR comes from selling an initial product to a smaller group or function within the payer, provider, or pharma customer, and then either growing the number of seats or the features or products they use from your company over time. NDRR also considers churned ARR, so keeping your customers satisfied is critical.
In tech-enabled services, you might land a customer contract, which simply means “go-get revenue,” but it often requires you to activate and engage members every year, or to achieve specific goals or “savings” to grow your revenue over time. In our Benchmarks for Growing Health Tech Businesses , we discussed the importance of tracking NDRR by customer cohorts to show your company’s ability to capture recurring revenue given that, by definition, tech-enabled services are not truly recurring but rather re-occurring.
Prove your worth: financial and clinical ROI
It’s difficult to make apples-to-apples comparisons between two health tech companies’ financial and clinical return on investment (ROI), but it’s still important to understand ROI and outcome measures on their own.
Financial ROI refers to the financial benefit delivered by your solution (e.g., emergency room visits prevented or clinician hours saved but also incremental revenue generated) compared to your customer’s spend on the solution you provide, while clinical ROI can refer to clinical outcomes offered by your solution more broadly.
Both of these metrics are calculated from your customer’s perspective and require a clear articulation of why such value should be attributed to your product or service in a short time period (often <12 months).
We encourage portfolio companies to invest early in measuring clinical and financial ROI, regardless of whether they are tech-enabled services or a healthcare SaaS business.
Clear proof of these metrics requires time and dollars invested, but will pay future dividends.
For example, Oshi Health , a Bessemer portfolio company that provides virtual whole-person gastrointestinal care, invested 12 months in running a clinical trial alongside a national health plan to recruit and treat 332 patients suffering from IBS, IBD, and other GI conditions.
By carefully designing the trial to measure commonly used GI endpoints, Oshi demonstrated 92% symptom improvement, 98% patient satisfaction, and statistically significant savings of $6.7K per patient from GI-related costs.
These well-validated financial and clinical outcomes unlocked better pricing, several state contracts with health plan partners, and drove inbound interest from dozens of other health plans and employers looking to contract with Oshi.
CAC payback
Measuring Customer Acquisition Cost (CAC) payback is key to understanding the efficiency of your sales and marketing investment, especially at the early stages when you don’t have enough longitudinal data to understand your customer’s lifetime value.
The CAC payback period is the amount of time it takes to pay back customer acquisition costs after accounting for variable expenses and COGS to service that customer.
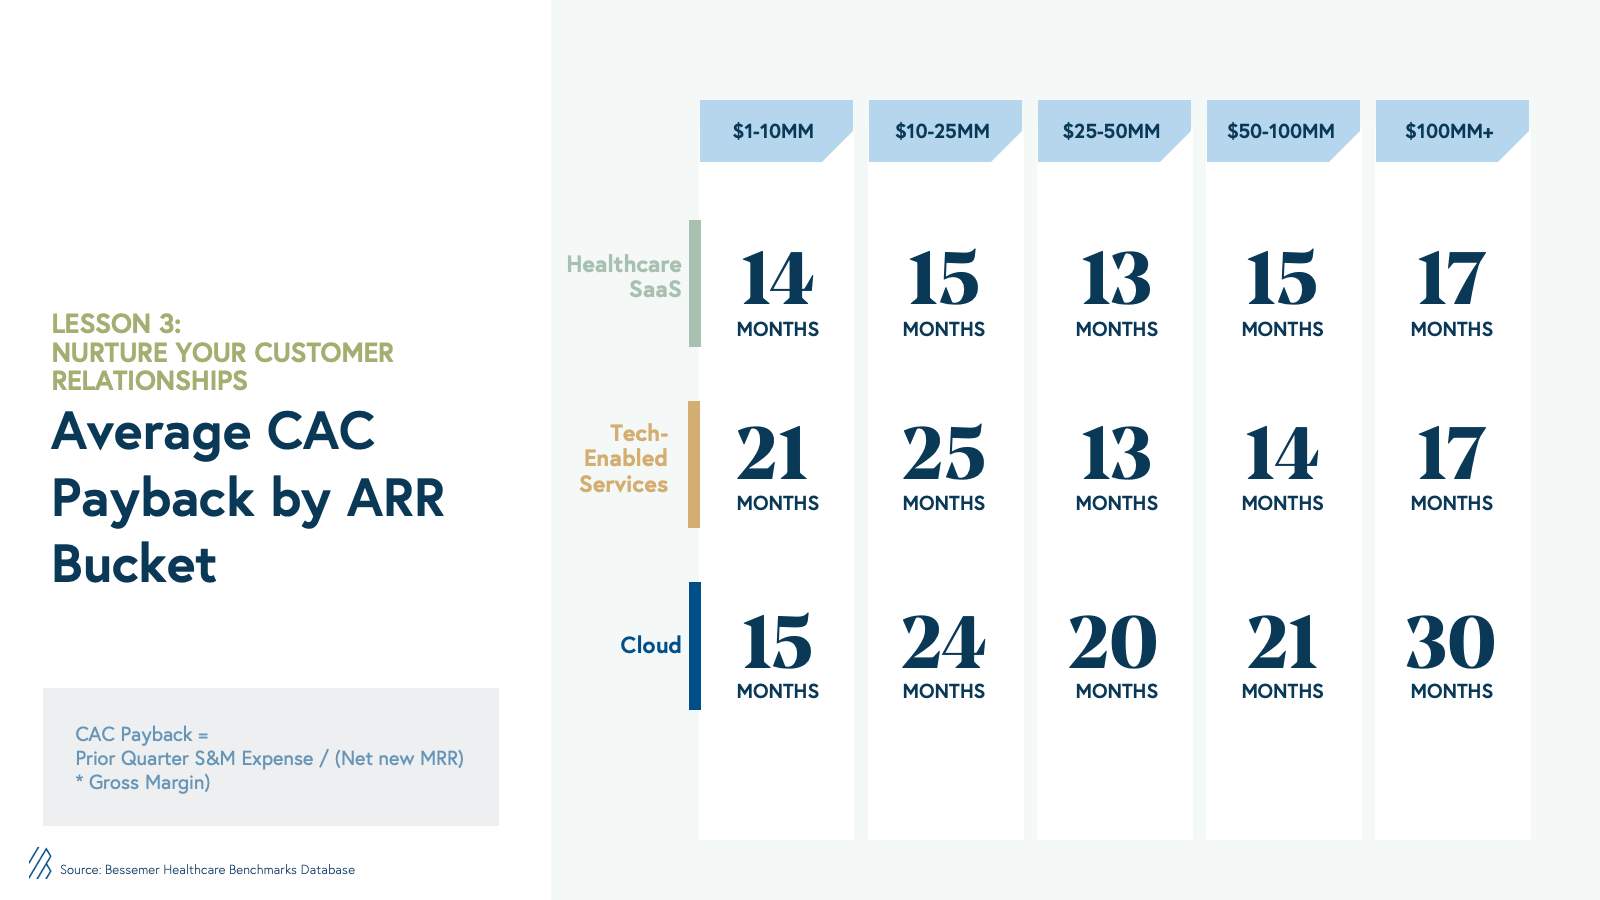
For tech-enabled services, CAC payback is long in the early stages: ~20–25 months for companies with less than $25 million in ARR. This is likely driven by:
- Slower sales motions, given the length needed to build customer relationships and prove your product’s value; and
- Lower gross margins, which impact how much of the monthly gross profit run rate you can capture for your S&M investment.
However, as a tech-enabled services company scales beyond $25 million of ARR, the CAC payback declines significantly to about 15 months.
Healthcare SaaS businesses have similar CAC payback to their cloud counterparts at the early stages but can maintain a consistent CAC payback period as they scale beyond $100 million ARR. This is likely driven by operating leverage from sales and marketing spend from stickier customers, growth within existing accounts to other parts of the organization, and referenceable customers.
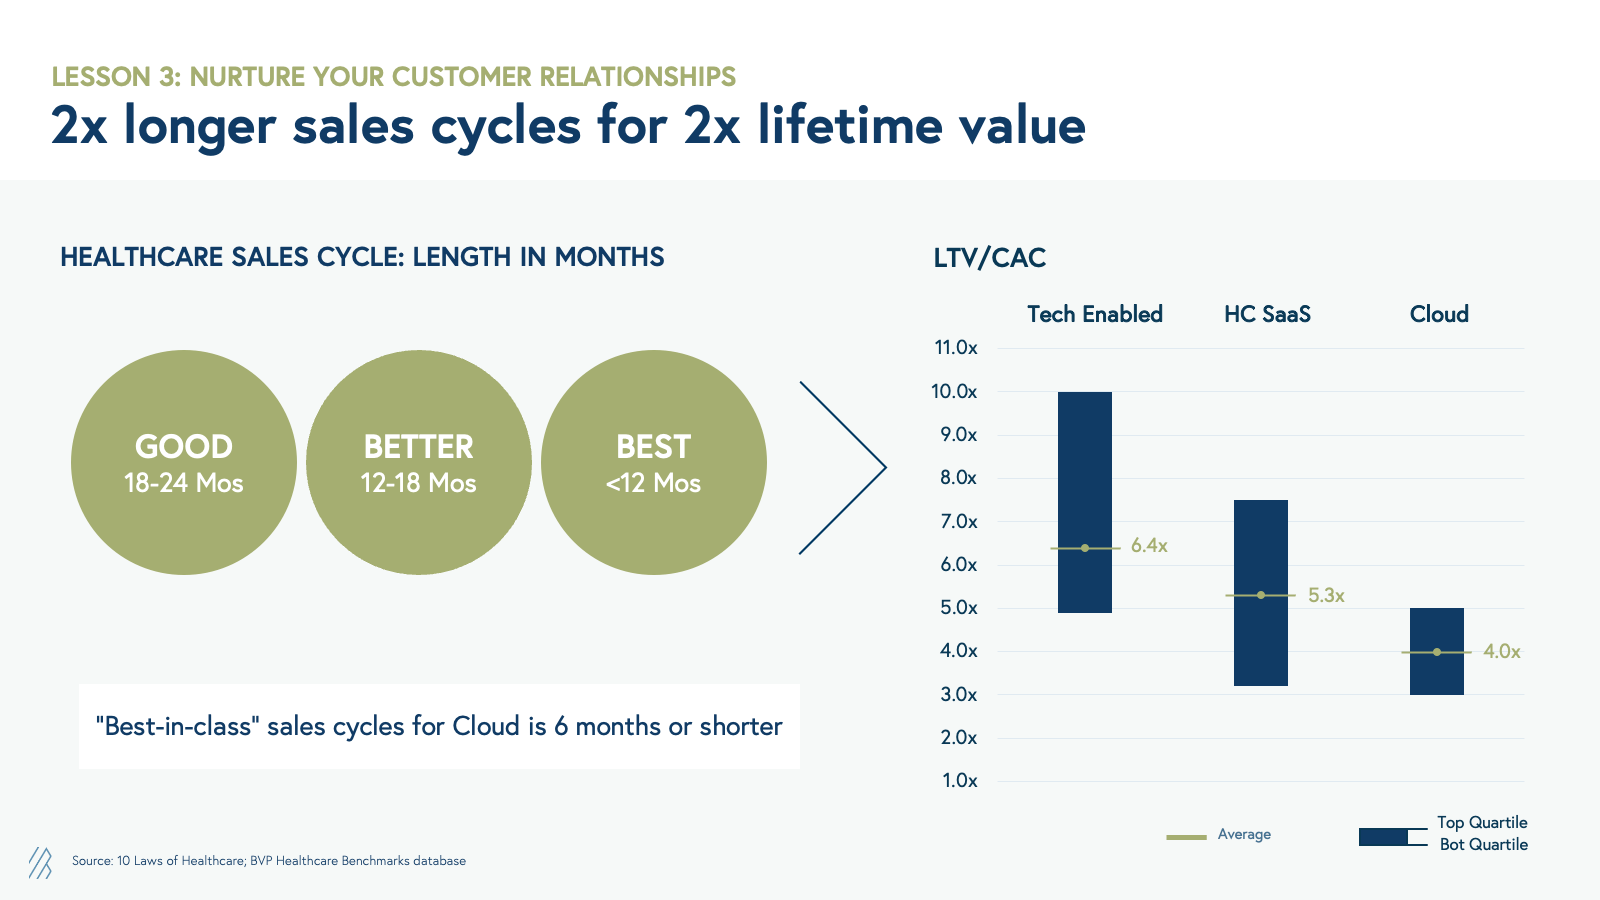
Double the time but double the value: sales cycles and LTV
Calculating sales cycle length and customer lifetime value (LTV) is more of an art than a science. However, we derived directional trends across industries and business models. We estimate that, on average, in healthcare, it takes twice as long to close a contract than in traditional Cloud business. Despite this, healthcare SaaS and tech-enabled services have LTV/CAC ratios almost double those of Cloud companies, making the long process well worth it. Once implemented, healthcare products tend to be sticky, explaining why at scale, health tech businesses are attractive cash-flow-generating companies.
Lesson #4: A love note to efficiency
After publishing our original benchmarks report , we’ve been asked to what extent the benchmarks are skewed to reflect the old bull market environment, rather than the premium placed on efficiency today.
We think our benchmarks are still relevant:
First, our database of over 100 venture-backed health tech companies includes a wide range of years going back to the early 2000s.
Second, we break out each ARR bucket and show the top, median, average, and bottom quartile for each metric at each stage.
The top quartile benchmarks for each metric are values that we consider efficient for each growth stage in any macroeconomic environment.
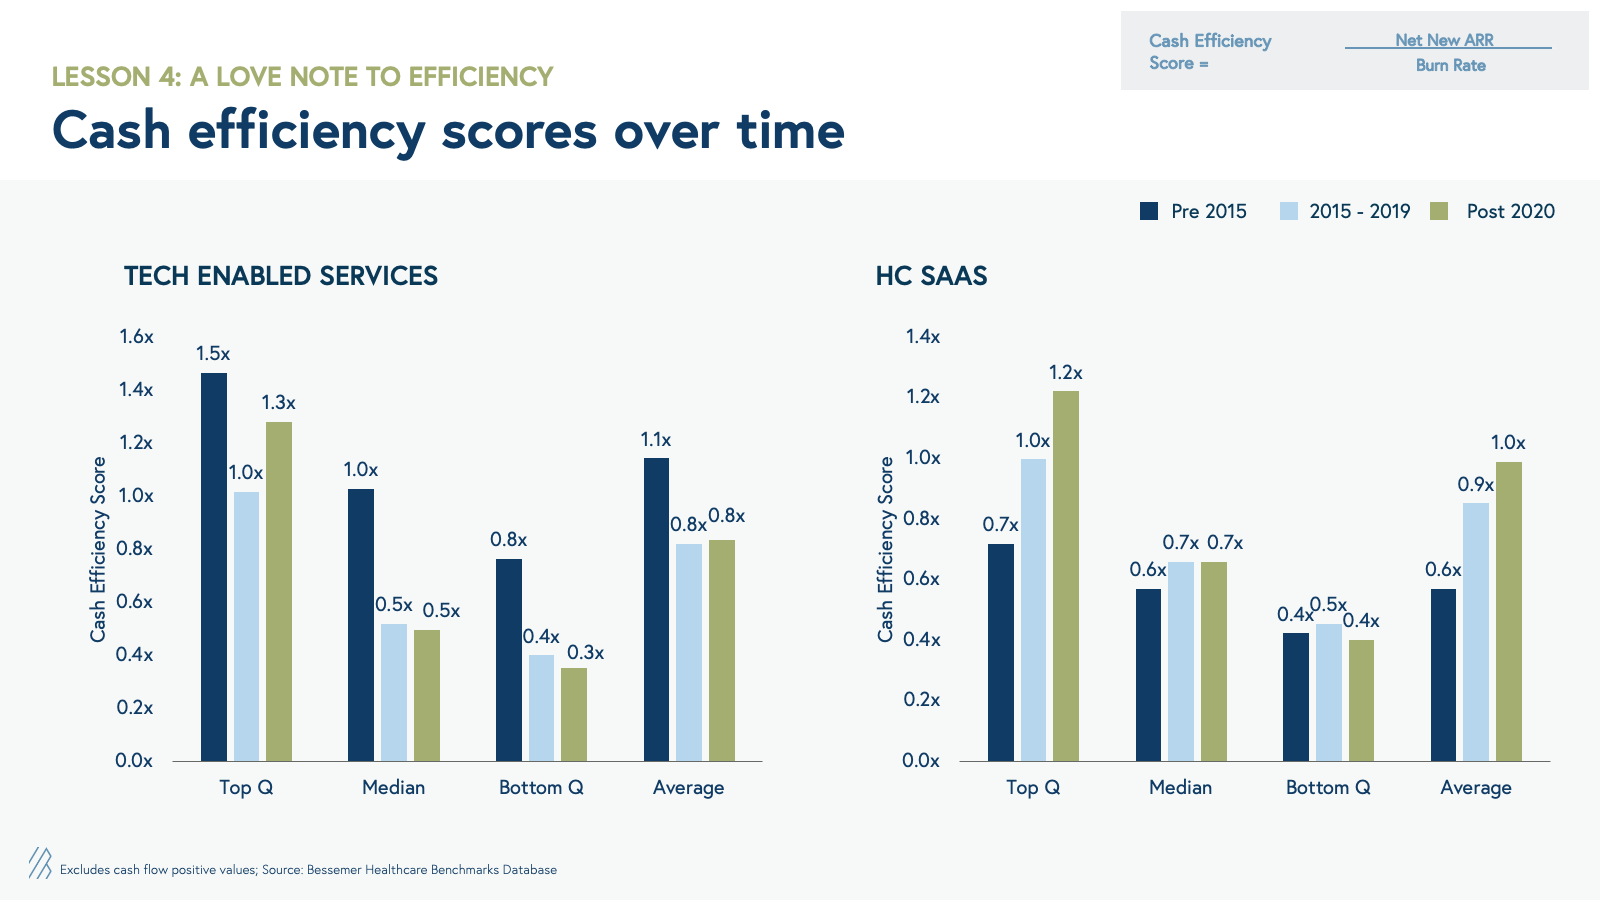
Furthermore, we went back and studied how cash efficiency scores have changed for the companies analyzed before 2015, 2015–2019, and 2020–2022.
You’ve probably heard of “burn multiples”: inversely at Bessemer, we think of efficiency scores as the ratio between net new ARR per dollar you burn.
As you can see in the graph below, the cash efficiency scores have remained relatively flat for each business model after 2015.
Most importantly, we see that the top-quartile efficiency scores are ≥1x, suggesting that health tech companies should strive to be in the top quartile of our benchmarks in the current market environment as well.
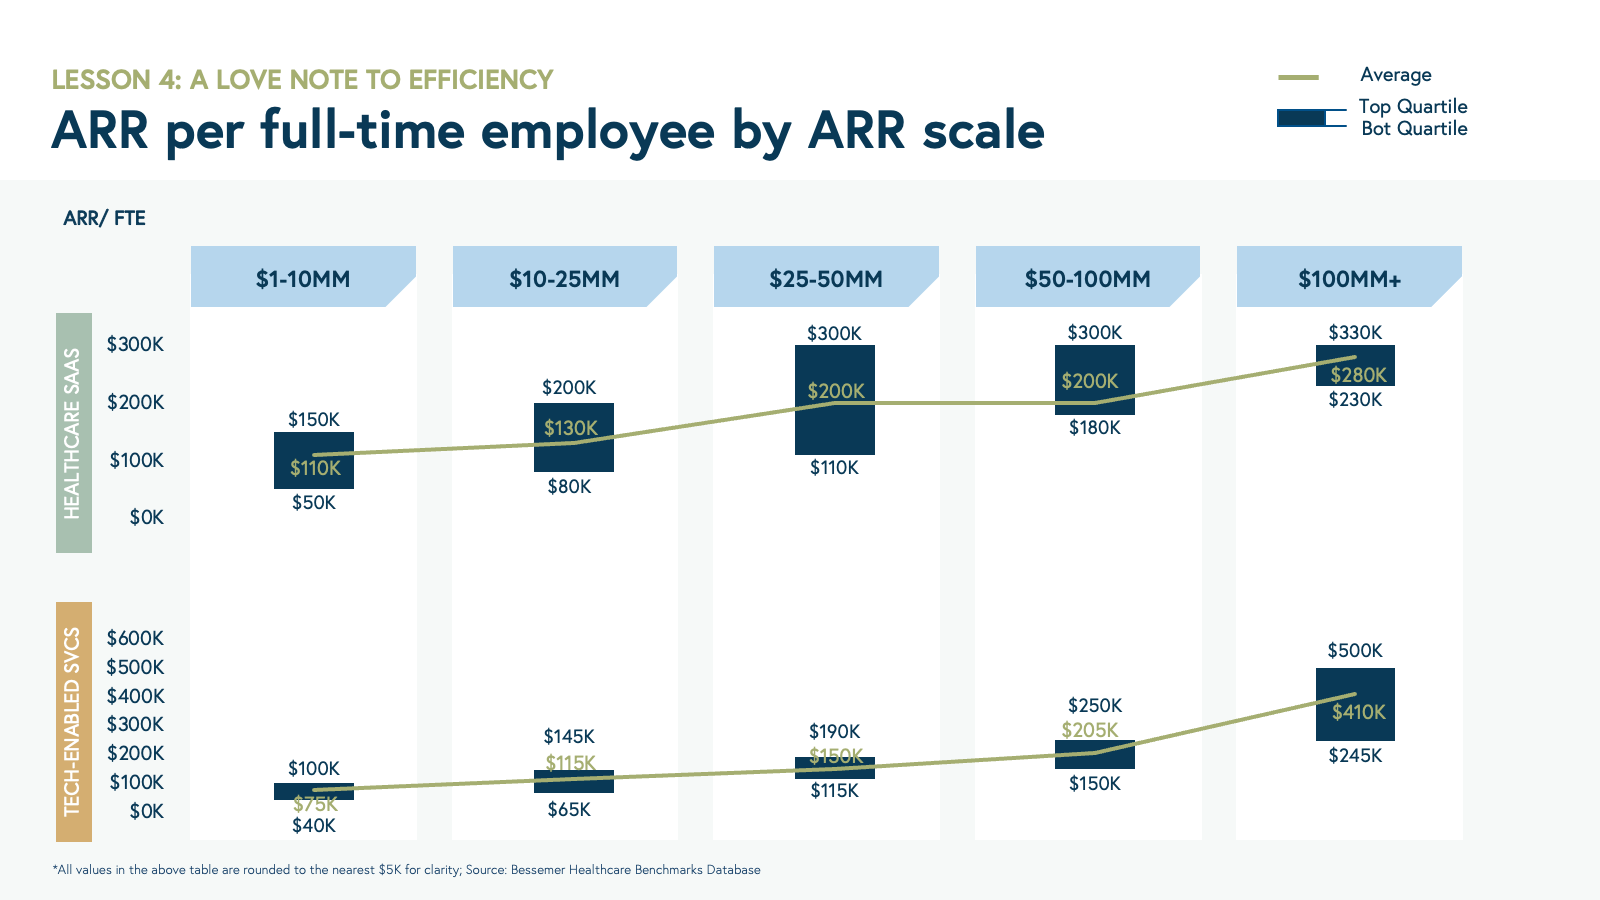
Another relevant efficiency metric as you scale is ARR per full-time employee (ARR/FTE). This is a productivity metric that indicates how each additional hire or existing employee adds to the top line. Each new hire will fuel growth; however, as a health tech business scales, we see that the productivity per employee increases at a faster rate. For healthcare SaaS, on average, we see ARR/FTE rise from $110,000 at $1 million to $10 million of ARR to $280,000 at $100 million of ARR and beyond. For tech-enabled services, there is a tighter band between the top and bottom quartile of ARR/FTE at each ARR scale, and a more significant increase in productivity going from $75,000 ARR/FTE at $1 million to $10 million of ARR, to $410,000 of ARR at $100 million and beyond.
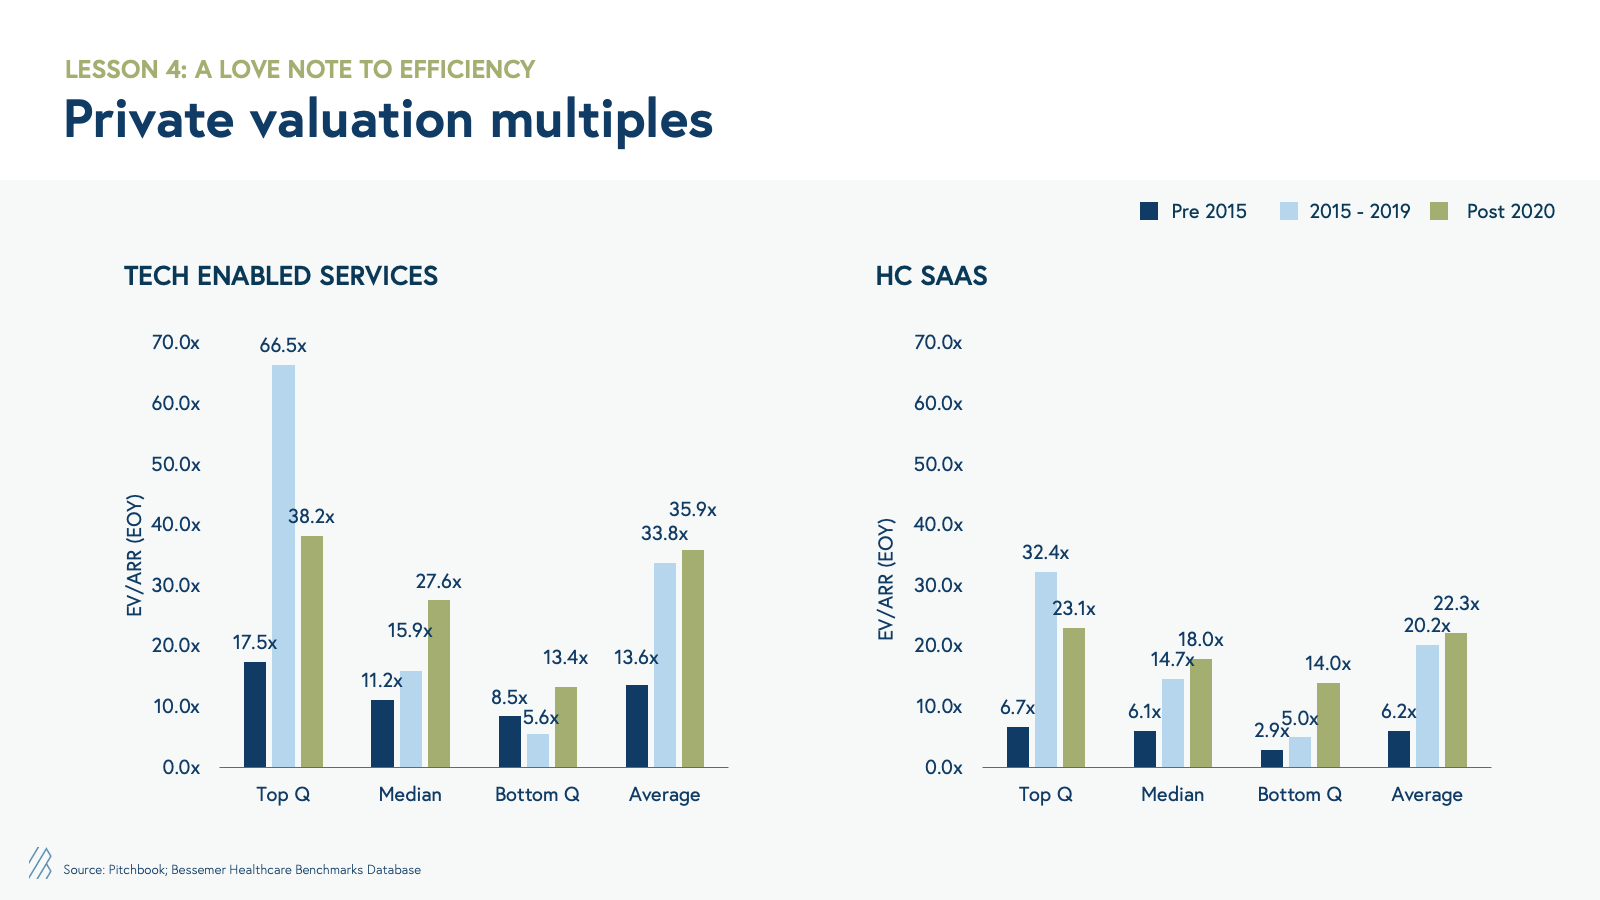
In our health tech public market analysis , we showed how public markets have valued both tech-enabled services and healthcare SaaS companies, on an EV/ARR multiple basis, at comparable revenue multiples between May 2020 and May 2021.
Since then, there has been a drop in EV/ARR multiples valuations across all business models, with tech-enabled services seeing the most significant decline. An analysis of the private market EV/ ARR (EOY) multiples shows that tech-enabled services were valued at higher multiples than healthcare SaaS counterparts as early as the 2015–2019 period and reached new highs in the 2020–2022 period.
Lesson #5: TLDR; Manage cash and plan your way to the next milestone
Healthcare entrepreneurship is a rollercoaster filled with highs and lows, and founders must balance stakeholder demands with diverse incentives, regulations, and most importantly, the well-being of patients.
The goal of our research is to provide portfolio companies, ambitious founders, and the health tech community with guideposts of what category-defining health tech companies look like.
We have selected over 100 public and private health-tech companies that we have had the pleasure of working with or that we think are best-in-class.
We don’t expect, by any means, that your business should only be in the top quartile category of these benchmarks for every metric.
Rather, we hope these metrics, alongside your particular business context, will help guide and inform important decisions as you scale your business.
BENCHMARKS
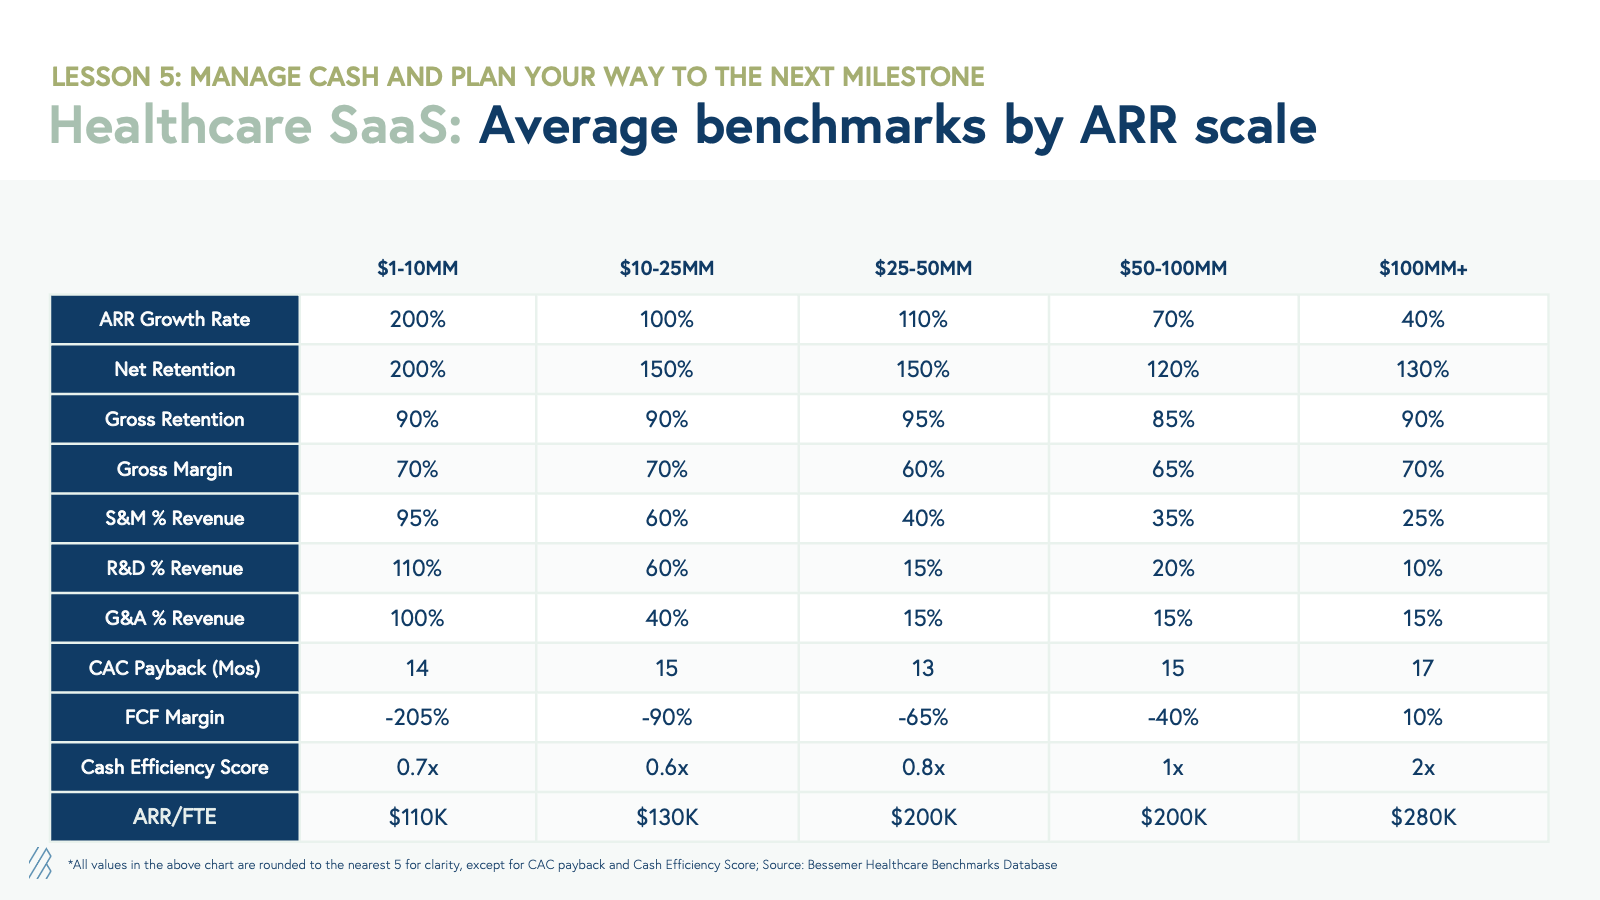
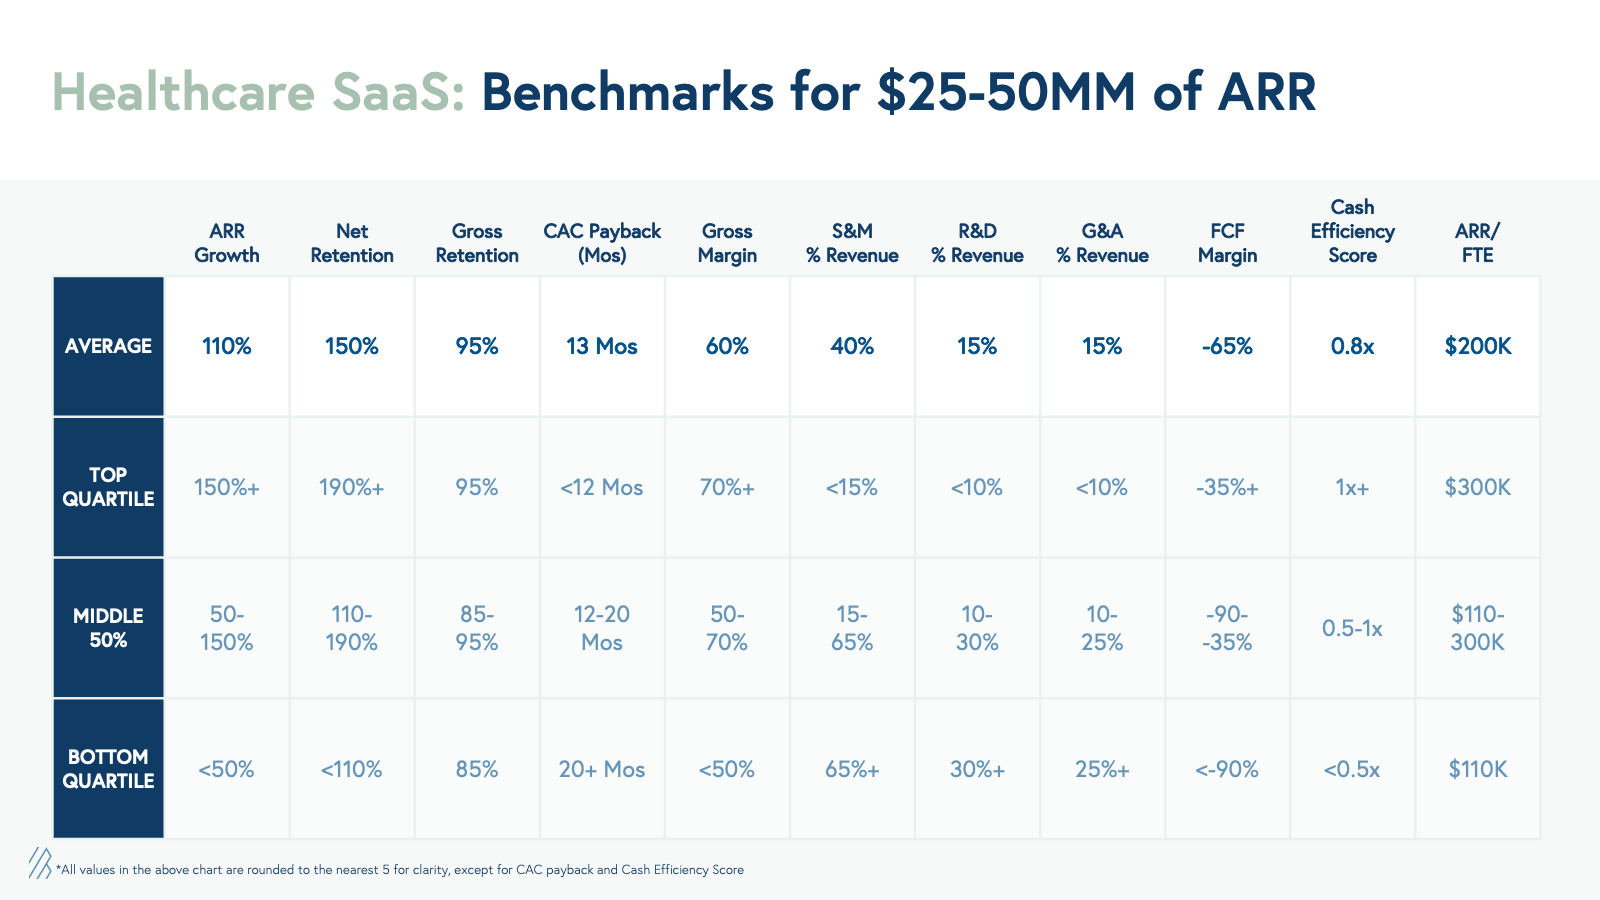
Healthcare SaaS: benchmarks by ARR scale
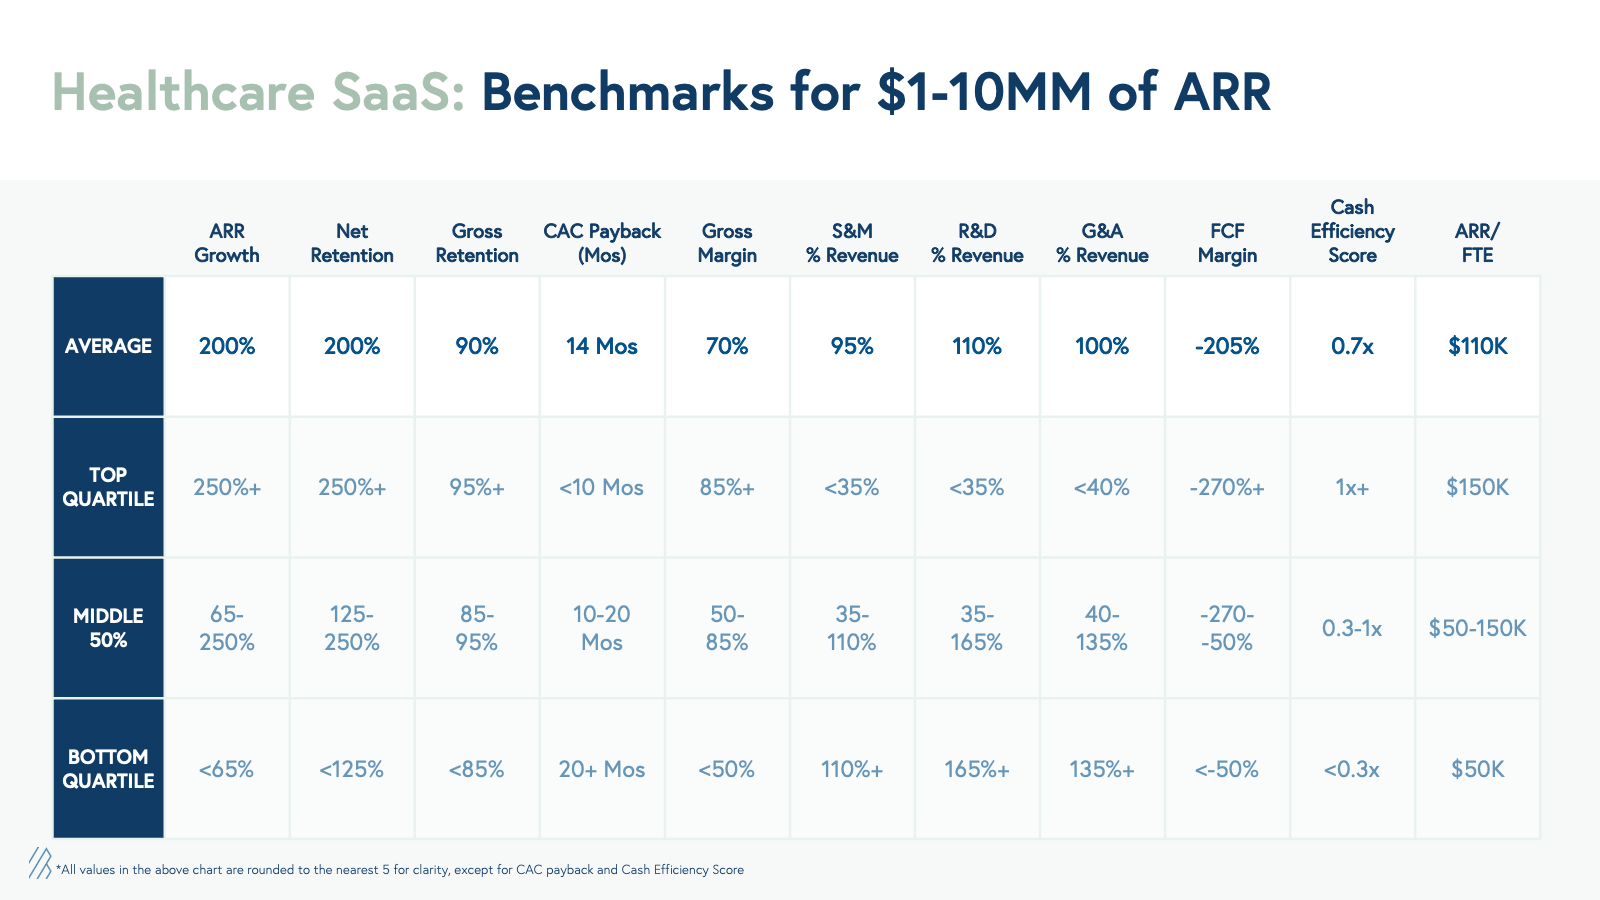
Benchmarks for companies with $1–10MM of ARR
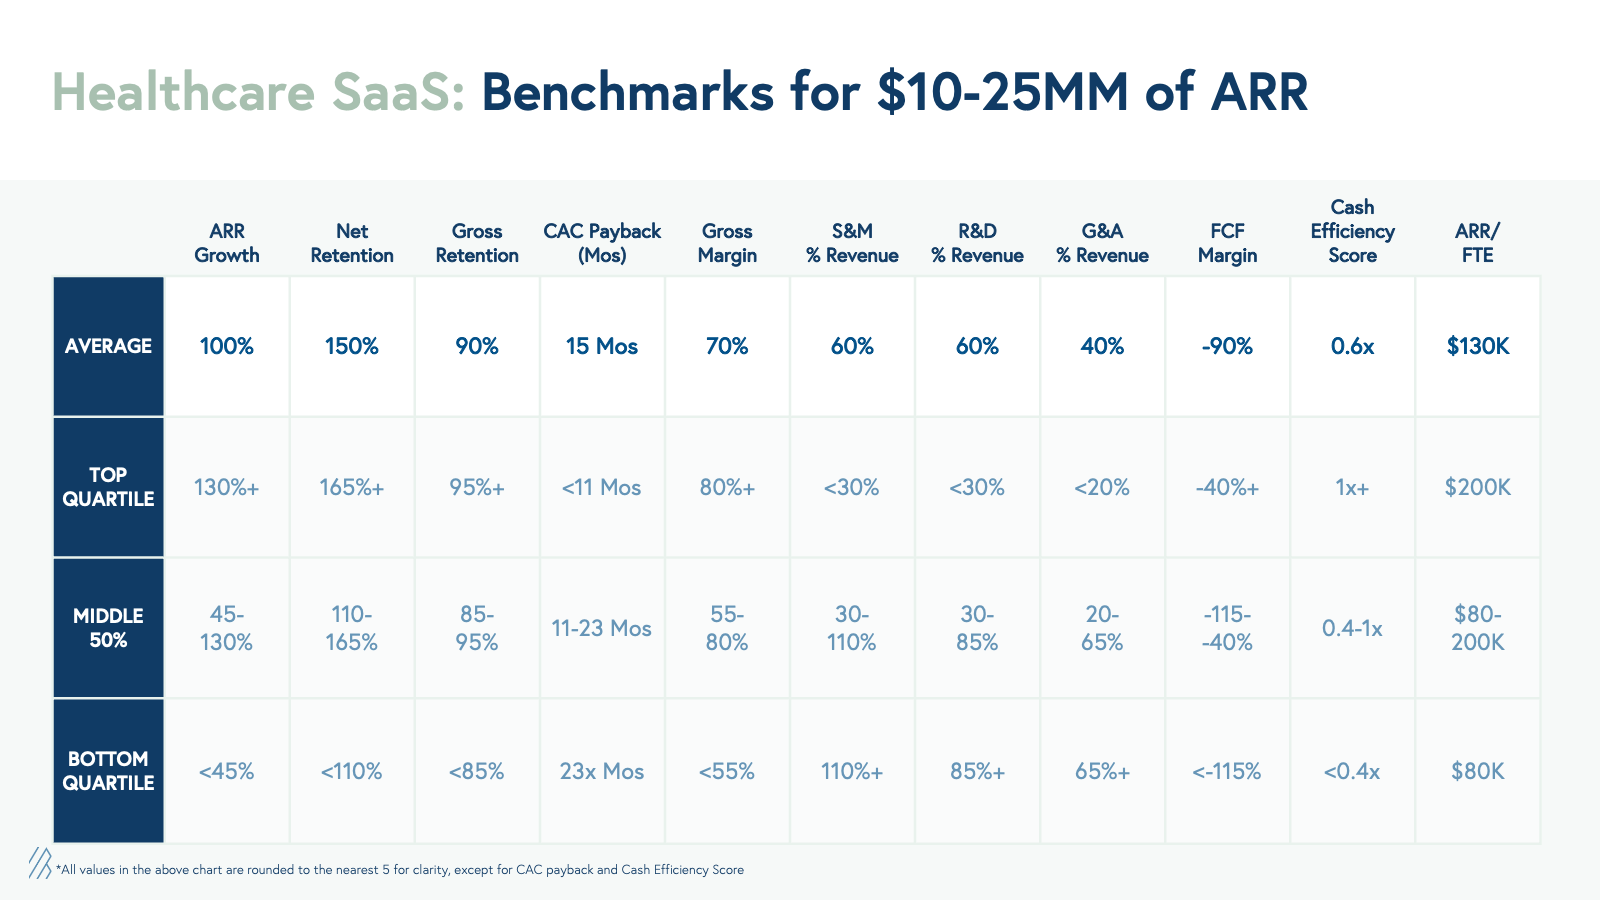
Benchmarks for companies with $10–25MM of ARR
Benchmarks for companies with $25–50MM of ARR
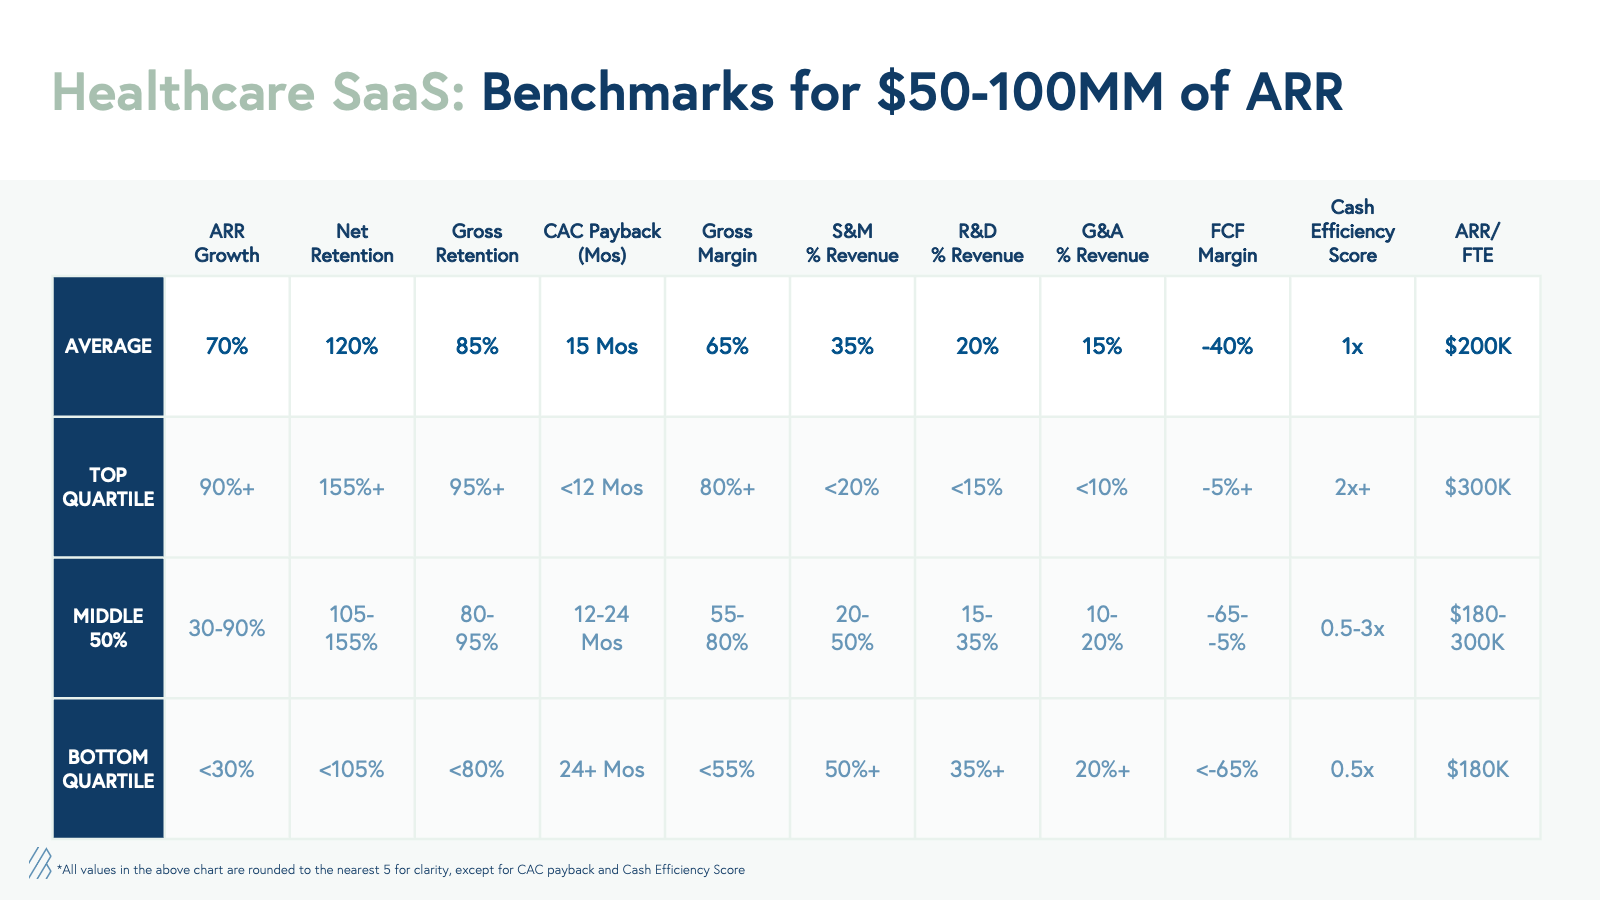
Benchmarks for companies with $50–100MM of ARR
Benchmarks for companies with $100MM+ of ARR

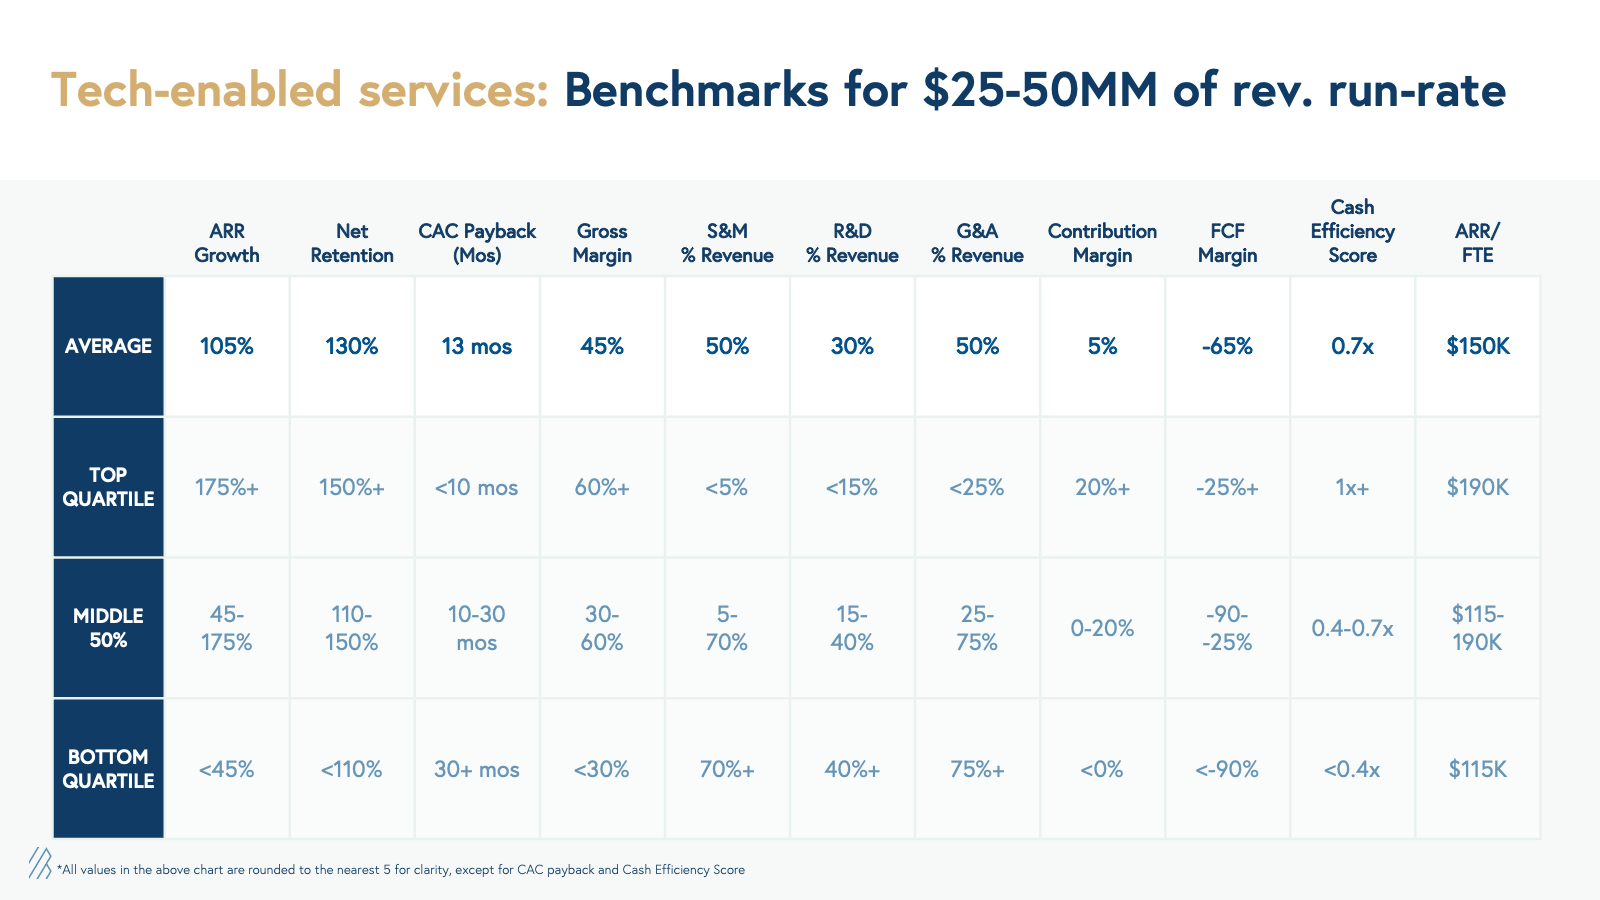
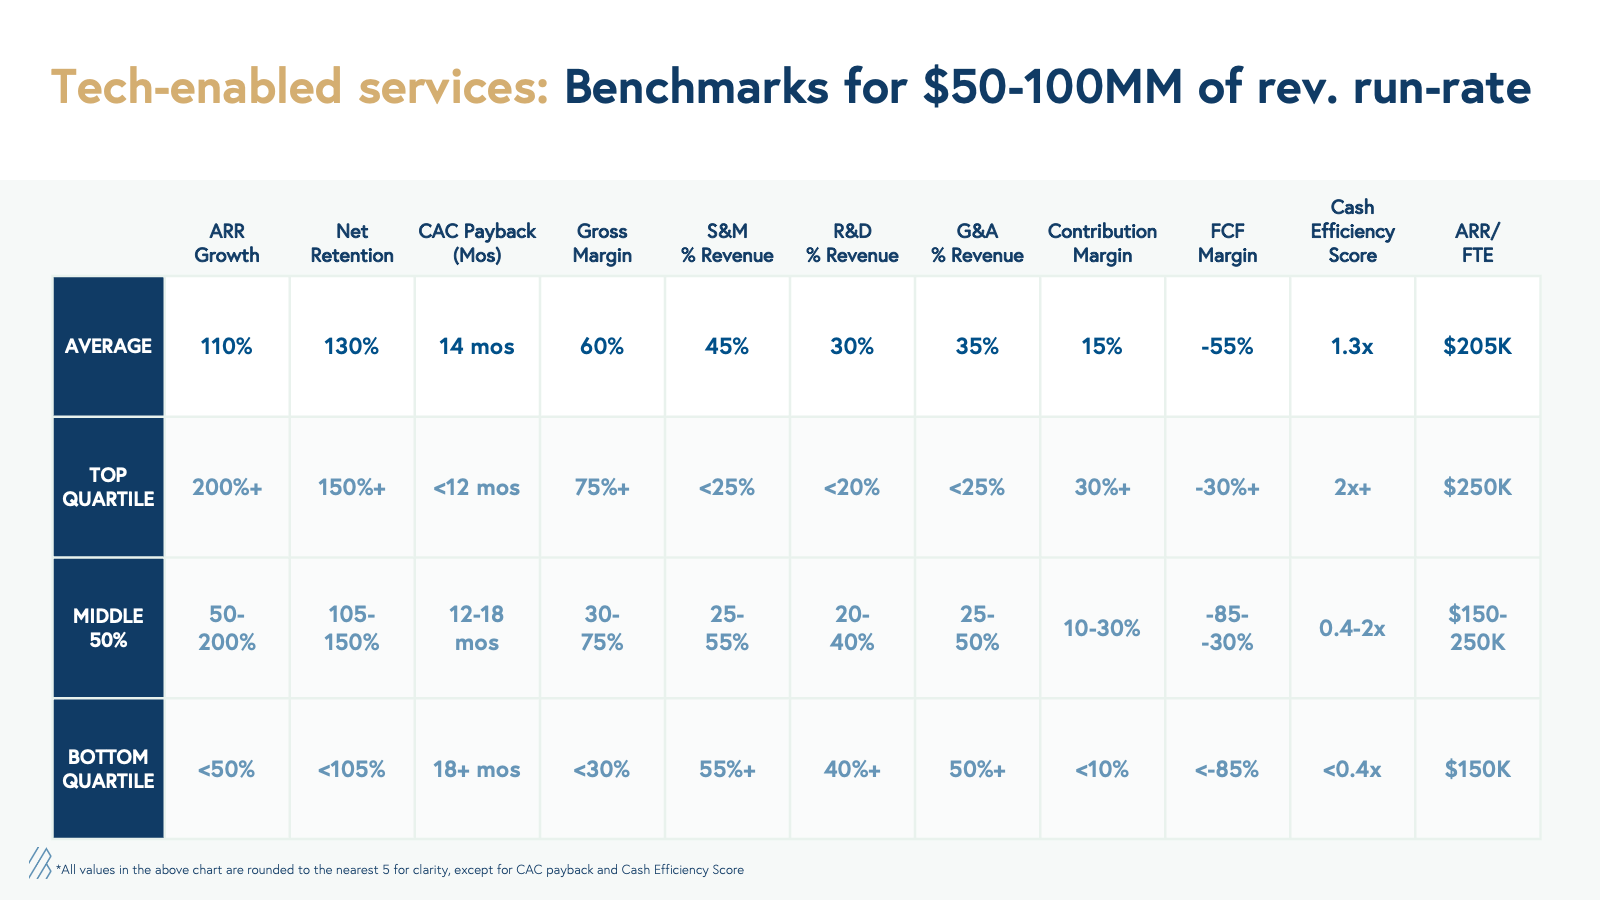
Tech-enabled services: benchmarks by ARR scale
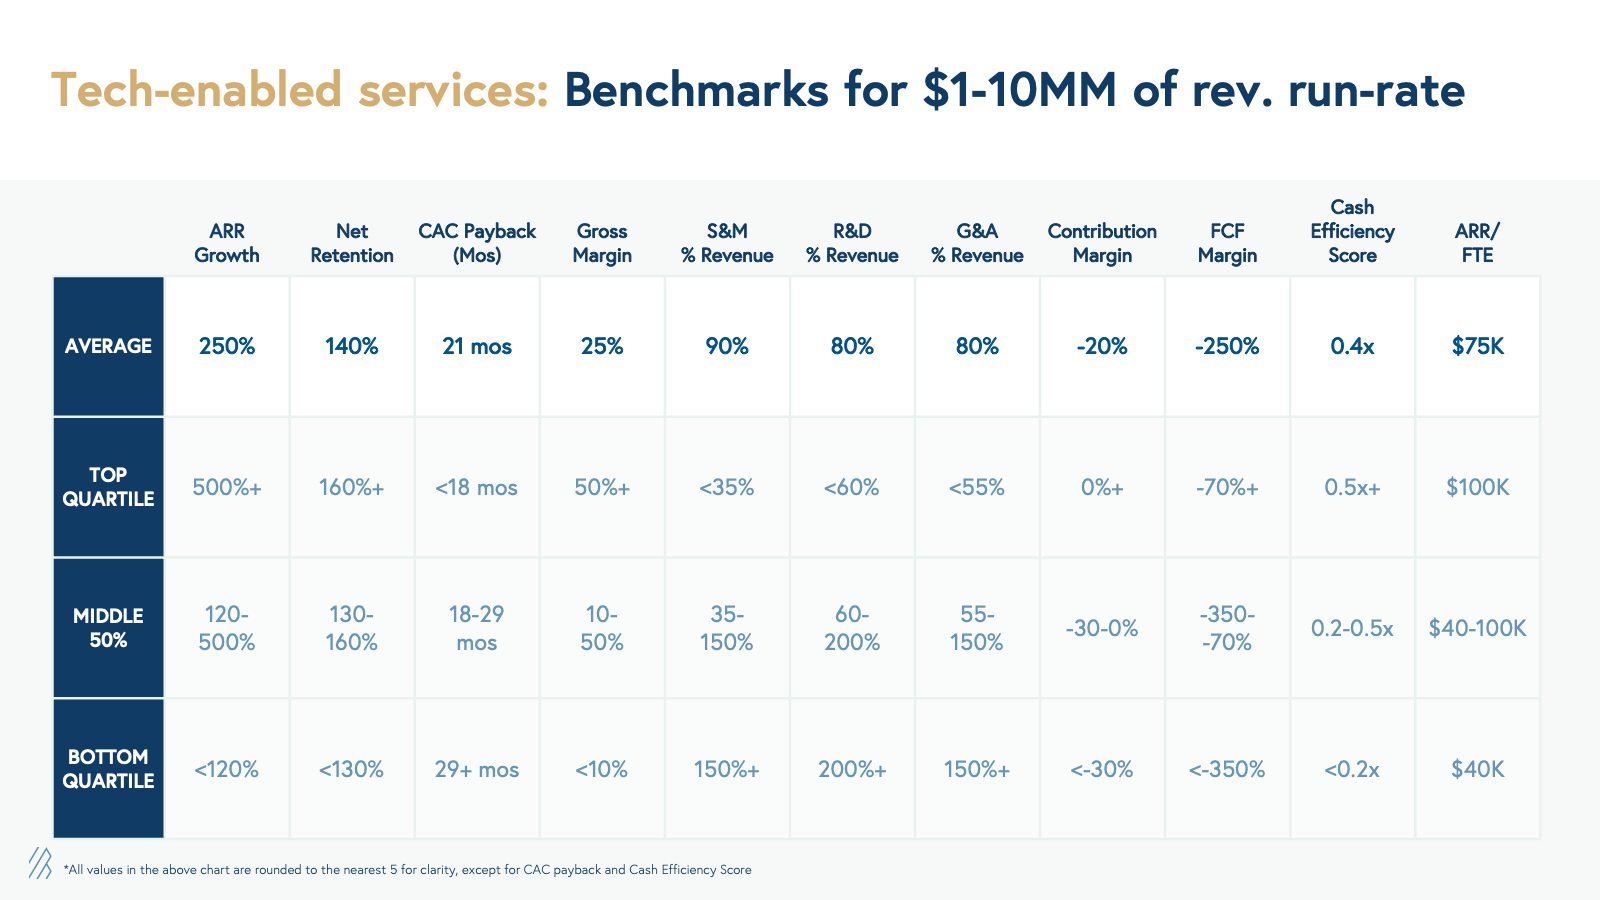
Benchmarks for companies with $1–10MM of revenue run-rate
Benchmarks for companies with $10–25MM of revenue run-rate

Benchmarks for companies with $25–50MM of revenue run-rate
Benchmarks for companies with $50–100MM of revenue run-rate
Benchmarks for companies with $100MM+ of revenue run-rate

Acknowledgements: We would like to thank Anna Lewandowska, Nicole Baker-Greene, and Shruti Rao for helping complete the Bessemer database with over 100 health tech businesses.
Originally published at https://www.bvp.com on April 5, 2023.