


This is a republication of an excerpt of the paper below, with the title above, highlighting the message in question.
Prognosing the risk of COVID-19 death through a machine learning-based routine blood panel: A retrospective study in Brazil
International Journal of Medical Informatics
Daniella CastroAraújoa b*, Adriano AlonsoVeloso b, Karina Braga Gomes Borges c, Maria das Graças Carvalho c
Accepted 19 July 2022
Executive Summary by:
Joaquim Cardoso MSc.
Health Transformation Journal
AI Health Transformation Institute
September 5, 2022 (scitechdaily)
Abstract
Background:
- Despite an extensive network of primary care availability, Brazil has suffered profoundly during the COVID-19 pandemic, experiencing the greatest sanitary collapse in its history.
- Thus, it is important to understand phenotype risk factors for SARS-CoV-2 infection severity in the Brazilian population in order to provide novel insights into the pathogenesis of the disease.
Objective:
- This study proposes to predict the risk of COVID-19 death through machine learning, using blood biomarkers data from patients admitted to two large hospitals in Brazil.
Methods:
- We retrospectively collected blood biomarkers data in a 24-h time window from 6,979 patients with COVID-19 confirmed by positive RT-PCR admitted to two large hospitals in Brazil, of whom 291 (4.2%) died and 6,688 (95.8%) were discharged.
- We then developed a large-scale exploration of risk models to predict the probability of COVID-19 severity, finally choosing the best performing model regarding the average AUROC.
- To improve generalizability, for each model five different testing scenarios were conducted, including two external validations.
Results:
- We developed a machine learning-based panel composed of parameters extracted from the complete blood count (lymphocytes, MCV, platelets and RDW), in addition to C-Reactive Protein, …
- … which yielded an average AUROC of 0.91 ± 0.01 to predict death by COVID-19 confirmed by positive RT-PCR within a 24-h window.
Conclusion:
- Our study suggests that routine laboratory variables could be useful to identify COVID-19 patients under higher risk of death using machine learning.
- Further studies are needed for validating the model in other populations and contexts, since the natural history of SARS-CoV-2 infection and its consequences on the hematopoietic system and other organs is still quite recent.
Detailed Conclusions
- Our findings contribute to consolidating previous studies focused on the prognosis of COVID-19, and highlight the importance of a simple CBC and other routine biomarkers for risk stratification and prediction of in-hospital mortality.
- In this scenario, we attempted to speculate and summarize possible mechanisms of severe SARS-CoV-2 infection and corresponding altered lab variables in order to assist clinicians to early discriminate those truly at higher risk of death, with a view to reducing mortality.
- However, it is essential that our algorithm can be tested in other populations in different geographic regions, exploring other contexts, since the natural history of SARS-CoV-2 infection and its consequences on the hematopoietic system and other organs is still quite recent.
- Finally, from the point of view of clinical contribution, our findings help to optimize the interpretation of data provided by a simple blood count and other routine biomarkers, allowing early risk stratification and prediction of hospital mortality.
- In light of this knowledge, the adoption of appropriate measures by the medical staff could reduce the mortality of patients with severe COVID-19.
ORIGINAL PUBLICATION (excerpt)
1. Introduction
Researchers have made unprecedented rapid progress in understanding the occurrence, progression, and treatment of the COVID-19 disease, but one of the most intriguing questions remains unanswered: why do some people die while others present mild symptoms?
Although previous studies have reported that older age, male gender, smoking, and other conditions such as hypertension, diabetes mellitus, obesity, and chronic lung disease are risk factors for severe illness or death[1] [2] [3], these factors alone do not explain all variability in disease severity observed among individuals.
Recently, the COVID-19 Host Genetics Initiative has reported 13 genome-wide significant loci that are associated with SARS-CoV-2 infection or severe manifestations of COVID-19, several of them corresponding to previously documented associations to lung or autoimmune and inflammatory diseases[4].
Besides host genetics, it is well known that environmental, clinical, and social factors are also important to the disease severity[5].
Despite an extensive network of primary care availability, Brazil has suffered profoundly during the (SARS-CoV-2) pandemic, experiencing the greatest sanitary collapse in its history[6].
Home to just over 2.7 percent of the world’s population, Brazil accounts for almost 12% of recorded fatalities.
With 30.6 million cases and 664 thousand deaths (as of 6 May 2022), the country has the second-highest total of deaths in the world, behind only the United States[7].
In this context, it is highly relevant to study the patterns associated with the mortality rate due to COVID-19 in Brazil.
Previous studies have used blood biomarkers data to develop prognostic models for COVID-19 death using Machine Learning (ML), frequently reaching over 0.90 Area under the ROC Curve (AUROC).
These studies suggest that ML tecniques are able to unlock the predictive power of non-linear relationships between blood biomakers[8].
Therefore, in addition to the most common assessment methods used to monitor the progress of pulmonary disease, such as X-rays and CT-scan images, blood tests could also be used as indicators of the COVID-19 severity[9] [10].
One of the first studies to address the problem was the retrospective proposed by Yan et al. (2020)[11].
They used a database of 375 patients from a hospital in Wuhan, China, to develop a ML model using lactic dehydrogenase, lymphocyte and high-sensitivity C-reactive protein (hs-C-reactive protein (CRP)) as features, and further validated the model using a database of 110 patients[12].
In the recent survey conducted by Carobene et al. (2022)[13], they found 34 ML studies that aim to predict the risk of intensive care admission, mechanical ventilation and/or death due to COVID-19 using blood biomarkers, demographic characteristics, comorbities and vital signs as features.
Four of these studies used only laboratory data as features[14] [15] [16] [17], of which none have been externally validated.
Booth et al. (2020) have built a panel composed of five lab biomarkers (c-reactive protein, blood urea nitrogen, serum calcium, serum albumin, and lactic acid) of 398 patients from Texas, USA, for the prediction of death by COVID-19.
They achieved 93% AUROC using a support vector machine model[18] From a database of 196 hospitalized patients from Wuhan, China, Luo et al. (2021) proposed a multi-criteria decision-making algorithm that achieved 93% AUROC using only CBC biomarkers and age to predict severity risk due to COVID-19[19].
Qomariyah et al. (2021) analysed a dataset composed of 1,000 patients from Indonesia to build a model for predicting the risk of COVID-19 death, using eleven blood biomarkers[20].
Analysing routine blood analytes, Darapaneni et al. (2021) presented a lasso regression that obtained 87% f1-score for predicting the risk of ICU hospitalization, using a database of 5,644 individuals from a brazilian hospital[21].
Besides the latter, other prognostic studies were conducted using Brazilian databases.
Analysing a brazilian dataset composed of 1,945 patients from a Brazilian hospital, Aktar et al. (2021) developed ML models to predict the risk of ICU admission, trained with routine blood biomarkers and other parameters, such as comorbidites and blood gas analysis[22].
Fernandes et al. (2021) developed a ML model to predict the risk of ICU admission, use of mechanical ventilation and/or death analysing a database of 1,040 patients from a hospital in Brazil, using the routine biomarkers lymphocytes, CRP and ferritin, together with Intensive Care Unit (ICU) scores[23].
Famiglini et al. (2022) developed ML models for the prediction of ICU patient admission using only Complete Blood Count (CBC) data from Italy[24], which has been further externally tested in databases from multiple countries[25], but had the worst performance rates in the Brazilian ones.
All of these studies aimed to predict the risk of ICU admission, and some of them used parameters other than routine blood biomarkers.
Therefore, to our knowledge, there are no previous studies that have developed ML risk models to predict the risk of death by COVID-19 using only routine and non-expensive blood biomarkers data in Brazil.
Therefore, to our knowledge, there are no previous studies that have developed ML risk models to predict the risk of death by COVID-19 using only routine and non-expensive blood biomarkers data in Brazil.
Here, we propose a ML model for death prediction caused by COVID-19 disease that was obtained by combining different routine laboratory blood biomarkers data.
We have considered only blood tests collected in a 24-h time window before or after the first positive Reverse Transcription–Polymerase Chain Reaction (RT-PCR) diagnosis.
We used datasets from two private Brazilian hospitals — Hospital Sírio Libanês (HSL) and Hospital Beneficência Portuguesa (HBP)[26].
Validation was performed both intra and inter-hospitals, and five different measures were reported: AUROCs for training and cross-validation testing at each hospital, AUROC for training and cross-validation testing at both hospitals together, and AUROCs for training in one hospital and external testing in the other.
Besides being the first study to use only routine laboratory variables to predict the risk of COVID-19 death for patients in Brazil, another significant contribution of this study is that the proposed model was externally validated, limiting overfitting and underspecification risks.
Furthermore, our total database size is the biggest one in Brazil with a focus on this issue.
It is worth emphasizing that the identification of mortality predictors can be valuable for clinical risk stratification, which will undoubtedly contribute to optimizing monitoring and therapy of patients with COVID-19.
It is worth emphasizing that the identification of mortality predictors can be valuable for clinical risk stratification, which will undoubtedly contribute to optimizing monitoring and therapy of patients with COVID-19.
2. Methods
See appendix (republished on the bottom of this post)
3. Discussion
Currently, there are several studies around the world using machine learning tecnique based on different characteristics easily obtained from patients with COVID-19[1] [2] [3] and different outcomes such as need for intensive care, mechanical ventilation and death, among others.
Among these characteristics, laboratory test data have also been used in machine learning prediction models, rather than subjective data that could vary between geographic regions, ethnic characteristics, observers and institutions.
Using machine learning, the present study evaluated routine laboratory variables of patients with COVID-19 treated and/or admitted in two large hospitals in Brazil.
The objective was to investigate whether such variables would be able to predict the risk of COVID-19 death in order to assist clinicians to early discriminate those truly at higher risk of death.
The proposed machine learning model is composed of five biomarkers, namely RDW, MCV, CRP, lymphocytes and platelets, was reliably externally validated using a diverse external database against the training set, as well as showing sufficient cardinality and good performance in the complementary dimensions of discrimination, calibration, and utility.
The proposed machine learning model is composed of five biomarkers, namely RDW, MCV, CRP, lymphocytes and platelets, …
As observed in the model explanations (Fig. 5), the concentrations of these five biomarkers may increase or decrease the risk of death due to COVID-19 infection.
In an attempt to speculate and summarize the relation between lab variables and possible mechanisms of severe SARS-CoV-2 infection, we discussed each one of these biomarkers below.
We firstly discuss RDW, MCV, and CRP, biomarkers whose higher concentrations may increase the risk of death.
Then we discuss lymphocytes and platelets, biomarkers that have the opposite trend.
Bellan et al. (2021)[4] predicted in-hospital mortality by COVID-19 through the analysis of RDW, using a linear cutoff value for defining the prognosis.
Similarly, our results showed a greater risk for patients with relatively higher RDW, which indicates a variation in the volume of erythrocytes conventionally known as anisocytosis.[5] [6].
Particularly, in the context of inflammation, the cytokine storm that occurs in the most severe cases of COVID-19[7] may be closely related to the variation in the volume of erythrocytes.
As reviewed by Ganz & Nemeth (2015)[8], infectious or inflammatory stimuli account for the characteristic hypoferremia of inflammation that develops a few hours after systemic infection.
Thus, there is a lower iron supply to the bone marrow for hemoglobin production, which ultimately contributes to the reduction of globular volume resulting in microcytosis.
In contrast, other factors contribute to the increase in erythrocyte volumes such as comorbidities, folate deficiency, and the use of drugs such as folate inhibitors and others. Such factors, overall, prevail over microcytosis given the increased values of the MCV indicating macrocytosis.
Therefore, the coexistence of erythrocytes that became microcytic and macrocytic for different underlying causes and at different times of infection, in our view, partially explains the increase in both RDW and MCV values.
Fig. 6. (6a, c and e) t-SNE visualization of the individuals, clustered based on their raw features values (i.e., analytes concentrations in the blood).
Red dots represent individuals who died, whereas blue dots represent individuals who were discharged. (6b, d and f) t-SNE visualization of the individuals, clustered based on Shapley values.
This visualization represents the ability of our model to separate these two groups. of individuals.

Still referring to RDW, a priori, the increase in RDW already signals the beginning of a disorder in erythropoiesis and/or abnormal red blood cell survival[9], while all other blood count parameters may still be normal.
Thus, the RDW measurement is a parameter of considerable clinical importance given its early change.
Moreover, the RDW value is being considered a strong and independent risk factor for death in the general population[10].
Intravascular hemolysis may also be an under-recognized complication of COVID-19[11].
Early reticulocyte release would increase not only MCV but also RDW.
The reduction in erythrocyte half-life may be a consequence of the presence of the virus itself as well as of the lung damage resulting from the SARS-CoV-2 infection maximized by the inflammatory process.
In fact, RDW has been used as an indicator of ineffective red cell production or hemolysis which has recently been identified as a predictor of poor prognosis in different cardiovascular and noncardiovascular diseases[12].
Hemostatic disorders during severe COVID[13] may also indirectly imply a reduction in erythrocyte survival due to the possible occurrence of thrombotic microangiopathy, defined by a set of manifestations including thrombocytopenia, microangiopathic hemolytic anemia, and multiple organ failure[14].
Our model also found increased CRP levels as an important biochemical variable in the prognosis of COVID-19.
CRP levels are increased in a number of inflammatory conditions[15]. Particularly in those with severe COVID, CRP is elevated in 75–93% of them[16].
As reported in a systematic review and meta-analysis[17], the most common laboratory abnormalities in COVID patients were elevated CRP (68.6%), lymphopenia (57.4%), and elevated lactate dehydrogenase (LDH) (51.6%).
Another meta-analysis[18] reported a significant association between lymphopenia, thrombocytopenia and elevated levels of CRP and COVID-19 severity.
Low relative values of lymphocytes and platelets were identified as indicatives of poor prognosis in patients infected with SARS-CoV-2 in our models.
Lymphopenia has been very frequently observed in patients with COVID-19 infection[19] [20] probably indicating a diminished immune response to the virus[21].
It has been described that SARS-CoV-2 infection may primarily affect T lymphocytes[22].
Since T cells are important for dampening overactive innate immune responses during infection[23], their loss during SARS-CoV-2 infection may result in a more severe inflammatory response.
According to Guan et al., 2020, the vast majority of patients (82.1%) have experienced SARS-CoV-2-induced peripheral blood lymphopenia suggesting possible pulmonary infiltration of lymphocytes and/or cell damage through apoptosis or pyroptosis[24].
In addition, the expression of ACE2 in lymphocytes turns them into potential targets of SARS-CoV-2, which results in cell death of both CD4 + and CD8 + T cells[25].
In this scenario, the analysis of the lymphocyte count is therefore a reliable indicator of the COVID-19 severity, and really useful in the monitoring and therapeutic decisions.
Moreover, after clinical improvement lymphocyte count is corrected[26].
In summary, lymphopenia has been associated with severe COVID-19 which may reflect systemic inflammation and response to pneumonia[27].
In summary, lymphopenia has been associated with severe COVID-19 which may reflect systemic inflammation and response to pneumonia.
Fig. 7. SHAP summary plots showing the effect of each feature in predicting the risk of death by COVID-19.

As for thrombocytopenia, several authors[28] [29] have reported that the drop in the number of platelets may indicate an unfavorable prognostic factor.
Three hypotheses related to decreased platelet number and its structure are proposed in severe COVID-19[30].
- Firstly, SARS-CoV-2 infection may reduce platelet production by bone marrow;
- secondly, there may be increased destruction of platelets by the immune system;
- and thirdly, platelet consumption due to aggregation in the lungs. As described by Tang et al., 2020, 71.4% of non-survivors had overt disseminated intravascular coagulation (DIC) during their hospitalization compared to only 0.6% of survivors.
As is widely known, platelet consumption may occur during DIC implying a reduction in its number[31].
It is also important to emphasize that the use of drugs to treat COVID-19 may be interfering with megakaryopoiesis, such as azithromycin[32] and hydroxychloroquine[33], causing drug-induced immune thrombocytopenia.
Furthermore, heparin-induced thrombocytopenia (HIT), a rare complication of heparin to thrombosis treatment in COVID-19 patients, associated with increased in vivo thrombin generation[34], cannot be ruled out.
To investigate the risk of sex bias, we have evaluated the models considering the sex dimension.
We have found that the models perform a little better for females, with an average AUROC of 0.92 ± 0.02, vs 0.90 ± 0.02 for males.
The reason for this difference may come from sex differences in COVID-19 case fatality, given that not only biological factors but also behavioural risk place men at a greater risk for death as a consequence of COVID-19[35].
However, this idea should be further investigated.
4. Limitations
Although our study was performed based on thousands of hospitalized patients and was robustly validated in five scenarios, including a reliable external one in terms of data similarity and data cardinality, some limitations should be noted.
First, our study did not exclude patients affected by liver, cardiovascular, renal, or malignant diseases, or other previous comorbidities and/or conditions that could bias our study.
Second, the used databases were collected before vaccination, and thus the models may not be applicable to vaccinated individuals.
Third, the external validation was performed using a dataset from the same country, unlike the study by Cabitza[36], which used datasets from several countries.
Finally, it is noteworthy that the results used in the present study were obtained through RT-PCR, the gold standard method for the diagnosis of SARS-CoV-2[37].
As this method involves the amplification of a small segment of the genetic material of the virus, it has a high specificity. However, the hypothesis of cross-reaction with other viruses that cause acute respiratory syndrome cannot be ruled out.
5. Conclusions
Our findings contribute to consolidating previous studies focused on the prognosis of COVID-19, and highlight the importance of a simple CBC and other routine biomarkers for risk stratification and prediction of in-hospital mortality.
In this scenario, we attempted to speculate and summarize possible mechanisms of severe SARS-CoV-2 infection and corresponding altered lab variables in order to assist clinicians to early discriminate those truly at higher risk of death, with a view to reducing mortality.
However, it is essential that our algorithm can be tested in other populations in different geographic regions, exploring other contexts, since the natural history of SARS-CoV-2 infection and its consequences on the hematopoietic system and other organs is still quite recent.
Finally, from the point of view of clinical contribution, our findings help to optimize the interpretation of data provided by a simple blood count and other routine biomarkers, allowing early risk stratification and prediction of hospital mortality.
In light of this knowledge, the adoption of appropriate measures by the medical staff could reduce the mortality of patients with severe COVID-19.
…from the point of view of clinical contribution, our findings help to optimize the interpretation of data provided by a simple blood count and other routine biomarkers, allowing early risk stratification and prediction of hospital mortality.
…the adoption of appropriate measures by the medical staff could reduce the mortality of patients with severe COVID-19.
Originally published at: https://www.sciencedirect.com
APPENDIX:

2. Methods
2.1. Data preparation
Retrospective data from patients treated and/or admitted at the HSL from feb/2020 to jun/2020 and HBP from feb/2020 to mar/2021 provided by FAPESP (Fundação de Amparo à Pesquisa do Estado de São Paulo) available at the COVID-19 Data Sharing/BR[1] were used.
These datasets contain electronic health records from individuals who have laboratory confirmation of COVID-19 by RT-PCR assays, as well as their outcome (death or discharge).
Firstly, we filtered the datasets considering only those individuals who had a positive RT-PCR result.
Then, we filtered the blood tests data in a 24-h time window before or after the positive RT-PCR diagnosis, and dropped individuals who did not have at least a CBC result.
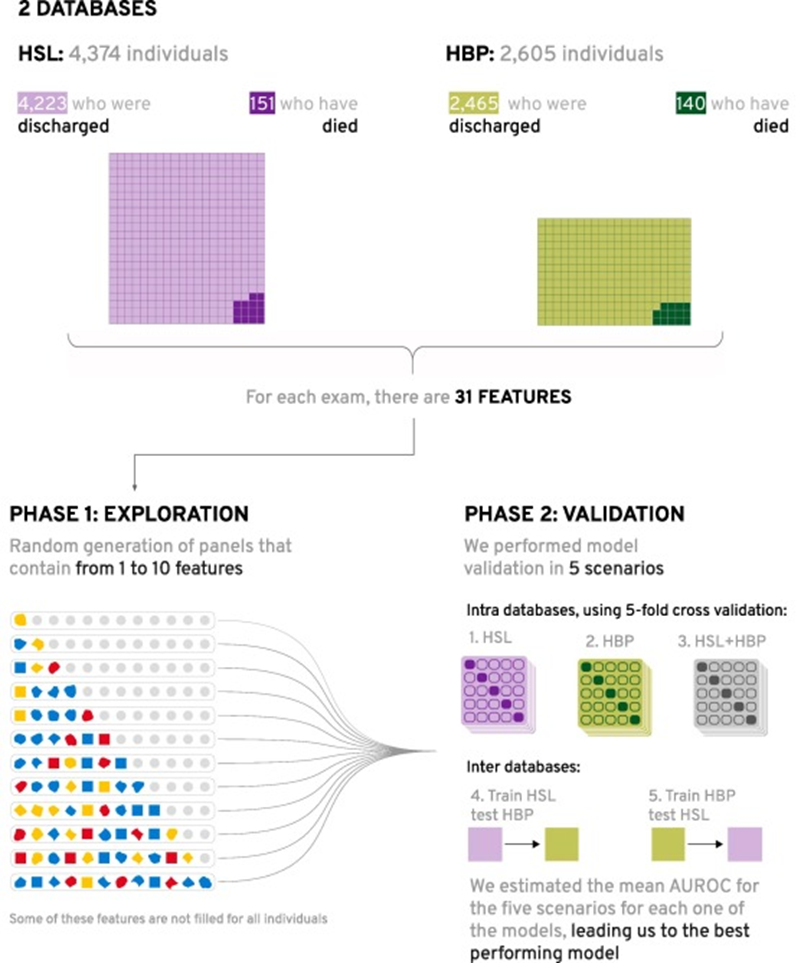
We ended up with 4,374 individuals originating from the HSL, of whom 151 (3.4%) died; and 2,605 from the HBP, of whom 140 (5.3%) died, totaling 6,979 unique individuals, of whom 291 (4.2%) died. Fig. 1 shows a diagram of the datasets filtering.
The datasets initially contained more than 300 biomarkers each. After filtering the biomarkers that had results for at least 80% of the individuals for both datasets, we ended up with 23 biomarkers, plus sex.
We also calculated seven blood-cell-derived indexes, totaling 30 variables and 208,074 measures (excluding missing values).
To deal with the remaining missing values, we used an imputation approach based on K-Nearest Neighbors[2].
Supplementary material in Appendix 1, Table A1, shows the variables and number of measures for each database.
Because of the high imbalance regarding the target variable, given that our positive class corresponds to less than 6% of the databases, it seemed important to use a technique to adjust this issue.
However, the recent studies of van den Goorbergh et al. (2022)[3] indicated that imbalance is not a problem in itself: imbalance correction methods may cause poor calibration and even worsen model performance in terms of the AUROC.
Besides, Elor & Averbuch-Elor (2022)[4] study showed that balancing datasets with Synthetic Minority Over-Sampling Technique (SMOTE) re-sampling procedure may improve prediction performance for weak classifiers, but not for the state-of-the-art classifiers, such as lightGBM[5] and XGBoost[6].
Therefore, we chose to set an experiment to compare three different configurations of SMOTE to the as-is databases, that is, to training the model in the imbalanced databases.
We used balanced metrics to evaluate the performance of the model in each one of these as-is/oversampling scenarios.
2.2. Models
We developed a large-scale exploration of risk models for the binary prediction of COVID-19 death, each one exploiting different interactions between the 30 features’ raw values.
For each model, we randomly selected up to 10 features, thus resulting in models with diverse predictive performance.
The models were built using a fast implementation of the LightGBM algorithm[7], which produces a complex model composed of hundreds of simple decision trees that are finally combined into a single model by a process known as boosting[8].
The predictive performance of each model is presented as a standard area under the ROC curve (AUROC) measurement[9].
As LightGBM is capable of dealing with missing values, we opted not to use imputation techniques.
To deal with class unbalance, we set the LightGBM hyperparameter of ’is_unbalanced’ as true, which automatically balances the weight of each label based on the respective number of instances.
For each model, five different testing scenarios were conducted, being three internal (1–3) and two external (4–5): (1) training and testing with HSL dataset, using 5-fold stratified-cross-validation; (2) training and testing with HBP dataset, using 5-fold stratified-cross-validation; (3) training and testing with HBP and HSL datasets together, using 5-fold stratified-cross-validation; (4) training with HSL dataset and external testing with HBP and (5) training with HBP dataset and external testing with HSL.
In the first three scenarios, at each run, 4 folds were used as a training set and the 5th fold was used as a test set.
To avoid data leakage, the data splitting was performed before any pre-processing and model construction steps[10], namely (1) missing value imputation, (2) re-sampling, (3) feature selection and (4) hyperparameter optimization.
Fig. 1. Diagram of the number of individuals for both datasets.

We used the external robustness diagram proposed by Cabitza et al.[11] to display the external validation results, which integrates two different sets of metrics:
the minimum dataset cardinality[12], that shows if the external database has sufficient sample size; and the multivariate similarity[13] of the external dataset, with respect to the training set.
In addition, three quality dimensions are shown in light of the similarity: model discrimination power (AUROC); model utility (Net Benefit); and model calibration (Brier Score).
Similarly to FBeta-measure, which employs a parameter to control the trade-off between precision and sensitivity[14], we proposed to use a Weighted Balanced Accuracy (WBA), which is defined in (1).
Basically, we may improve sensitivity and specificity by optimizing WBA while performing a grid search on the model hyperparameters.
Table 1 summarizes the search grid and the selected parameters.
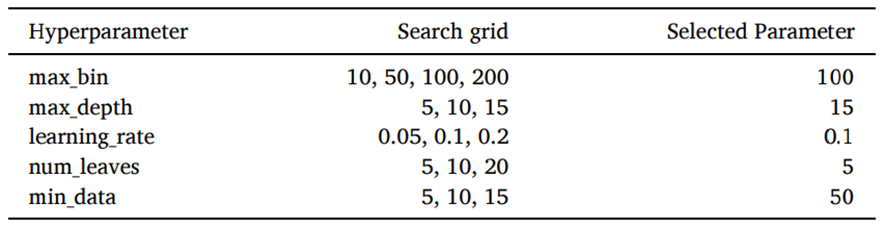
Fig. 2 presents the feature selection steps of the proposed methodology.
For every scenario, we reported seven different metrics, evaluated on the test sets, namely: AUROC, sensitivity, specificity, accuracy, balanced accuracy, WBA and the Brier score (as a measure of calibration).
We examined data of 4,374 individuals admitted in HSL, of whom 151 (3.4%) died; and of 2,605 individuals admitted in HBP, of whom 140 (5.4%) died.
Table 2 shows the baseline age and sex characteristics of the two groups for both hospitals.
Major comorbidities, ethnicity and socioeconomic status were not available.

After following the methodology represented in Fig. 2, thousands of models with randomly selected features were developed.
The one with the best performance in relation to the average AUROC estimate was obtained by plotting the rate of correctly classified positives among all positive predictions (i.e., the true-positive rate) as a function of incorrect positives among all negatives (i.e., the false-positive rate), at varying thresholds.
Because the output of the model is a probability (i.e., the risk factors for COVID-19 death), each threshold is a value ranging from 0 to 1.
Table 1 — Hyperparameter search space of the best model.
Fig. 2. Diagram presenting the datasets and the feature selection steps of the proposed methodology.
First, we went into a large exploration creating models from the random combination of up to 10 features (out of the 30 possible features).
Then, for each one of these models, five different testing scenarios were conducted, being three internal (1–3) and two external (4–5): (1) training and testing with HSL dataset, using 5-fold stratified-cross-validation; (2) training and testing with HBP dataset, using 5-fold stratified-cross-validation; (3) training and testing with HBP and HSL datasets together, using 5-fold stratified-cross-validation; (4) training with HSL dataset and external testing with HBP and (5) training with HBP dataset and external testing with HSL.
The mean AUROC and standard deviation (STD) of these five scenarios for each one of the models were estimated, and chosen the best-performing one (that is, the one with the highest mean AUROC with the lowest STD).
Table 2 — Descriptive statistics of Discharged vs Death groups in both hospitals.
Due to privacy concerns, HBP chose to omit most of the individuals’ age.
The best performing model had an AUROC of 0.91 ± 0.01 and was composed of a panel containing five plasma variables, CRP, limphocytes, medium corpuscular volume (MCV), platelets, and red cell distribution width (RDW), as shown in Table 3.
Table 4 compares the model performance using different balancing techniques:
SMOTE with three different configurations for the desired ratio between positive and negative samples (r): 0.1, 0.5 and 1.0, maintaing the default nearest neighbors number of 5; and the as-is database, with no oversampling.
Measures AUROC, Brier Score and WBA after threshold optimization are reported in terms of the mean ± std for the five testing scenarios.
As expected, because we use LightGBM, as the representative of the state-of-the-art[15], the general performance of the model is not improved with SMOTE.
Actually, when we use higher ratios of 0.5 and 1.0 (meaning that we oversample the positive class until it has the total number of samples of respectively half and the same as the negative class), the Brier Score increases.
On the other hand, when we use a ratio of 0.1 the performance metrics remain practically the same. Therefore, all the reported further results will consider the as-is scenario, without SMOTE oversampling. (see Table 5).
Table 3 — Descriptive statistics of the five features that compose the best model.

Table 4 — Performance of different oversampling scenarios.

Fig. 3 shows the AUROC performance for the five scenarios of our best risk model without oversampling (0.91 ± 0.01). Clearly, the predictive performance varies slightly within the internal and external validation scenarios (AUROC of 0.89, 0.91, 0.91, 0.91 and 0.92 for scenarios 1–5). The reliability (calibration) curves are shown in Fig. 4, the same pattern for the brier score (0.03 ± 0.00) can be observed.
For the threshold calibration[16], we moved the threshold for each scenario in order to find the probability cutoff that maximized the average WBA.
Table 4 shows the classification performance metrics of accuracy, balanced accuracy, sensitivity, and specificity for each one of the five validation scenarios using the calibrated threshold. In average, the models have a sensitivity of 0.88 ± 0.05, meaning that of 100 patients at higher risk, 88 would be recognized by the algorithm; and specificity of 0.76 ± 0.06, meaning that of 100 patients at lower risk, 24 would be wrongly recognized as at higher risk.
The high performance on both external testing sets may be justified by the high homogeneity of the two hospital datasets: they are both private hospitals located in the city of São Paulo, and their laboratory analyses are performed by the same company (Grupo Fleury).
To evaluate if the external validations could be considered reliable, we followed the methodology in[17], and estimated the similarity between each dataset with respect to the other, as well as their AUC values, net benefit, brier score, and respective cardinality for each one of these performance metrics.
We depicted these results in the external performance diagram, as shown in Fig. 5.
This diagram shows that the Minimum Sample Size (MSS) has been achieved for all metrics in both datasets, meaning that the datasets sample size, namely cardinality, is sufficient to guarantee the generalization of the results.
Besides, it shows that the HBP dataset has slight similarity with respect to HSL (0.33), and for all three performance metrics, this dataset had good (net benefit of 0.67) or excellent (AUC of 0.91 and brier score of 0.04) performance.
On the other hand, there is a high similarity for HSL with respect to HBP (0.72). So, although this validation achieved excellent performance in all three performance metrics (AUC of 0.92, net benefit of 0.75 and brier score of 0.03), because of the high similarity, this can only be considered as another internal validation analysis.
The high similarity of HSL in respect to HBP but not of HBP in respect to HSL may be justified by the temporal origin of the datasets: while HSL was collect only until jun/2020, HBP was collected until mar/2021, when the gamma variant was highly circulating in Brazil[18].
Finally, the proposed model can be considered externally validated, when trained in HSL and tested in HBP (Scenario 4).
Table 5 — Performance metrics for each one of the scenarios for the calibrated threshold.

Fig. 6 shows a 2D representation of the two groups: red dots represent individuals who died, whereas green dots represent individuals who were discharged.
To build these visualizations, we applied the t-distributed stochastic neighbor embedding (t-SNE) algorithm[19].
Unlike PCA, t-SNE is a non-linear dimensionality reduction technique that tries to preserve the local structure of data[20], thus performing usually better for machine learning visualization[21]. However, t-SNE is highly sensitive to the setting of hyperparameters, notably the perplexity[22].
Fig. 6 (a, c and e) represents the raw analytes’ concentrations for each individual for HSL, HBP and HSL + HBP, respectively.
No clear distinction between the two groups was found, reflecting what might be observed in attempting to draw linear correlations between the five biomarkers.
On the other hand, Fig. 6 (b, d and f) represents the corresponding marginal contributions of each analyte to the models, named Shapley values[23], reflecting all the non-linear interactions between these five biomarkers involved in the decision process of our models for HSL, HBP and HSL + HBP, respectively.
In this scenario, a distinction between the two groups can be seen.
For coherence in the comparisons, we have used the same hyperparameters for each pair of visualizations: perplexity was defined as 1% of the size of each dataset[24]; the initialization of embedding was set to PCA; and the other hyperparameters were set as the default of sklearn package.
For sensitivity analysis, we have also tested perplexities of 0.5% and 10%, and the tendencies remain the same.
In order to assess the importance of the features and thus extract intuitive insights from the prediction, the SHAP algorithm[25] was applied to the model.
Briefly, SHAP calculates the importance of each feature by estimating the effect of its absence on the model’s decision.
The importance of each feature for every individual was graphically represented, and these results are shown in the SHAP Summary Plot (Fig. 7), where features are depicted in order of importance.
Red dots are associated with individuals for which the corresponding biomarker (feature) shows a relatively higher value.
On the other hand, blue dots are associated with individuals for which the corresponding biomarker shows a relatively lower value.
Further, there is a vertical line separating patients — the dots located on the left side are those for which the model provided a negative decision (discharge) and, on the right, those related to death.
Fig. 7 a shows the SHAP Summary Plot for the model trained on the HSL database, 7b for the model trained on HBP database, and 7c for the model trained on HSL and HBP databases together.
Fig. 3. AUROC curves for the five validation scenarios.

Fig. 4. Reliability curves for the five validation scenarios.

Fig. 7 presents the five biomarkers that compose the models shown in order of importance for the HSL, HBP and HSL + HBP datasets.
Although the order of importance of the features differs in the three presented SHAP summary plots, we can see that the SHAP values largest, smallest and mean observations for each feature in each one of the three models are extremely close.
This indicates that there is no significant difference among the three models’ decision mechanisms.
Furthermore, in all three SHAP summary plots, we can observe the same tendencies for each feature, reinforcing the consistency between the three models.
We can see more red dots on the right and blue dots on the left side for RDW, CRP and MCV, meaning that individuals most likely to die due to COVID-19 usually have higher values of these variables than individuals who survive.
In the cases of lymphocytes and platelets the inverse pattern is observed, that is, most of the blue dots are concentrated on the right, and the red dots on the left side, meaning that individuals with a higher probability of dying due to COVID-19 usually tend to have a lower count of these two hematological parameters than surviving individuals.
However, it is noteworthy that, although the variables are evaluated individually, their corresponding importance is estimated taking into account the non-obvious interactions among all features within the model.
Fig. 5. External performance diagram displays the results of the validations of scenario 4 (train HSL →test HBP) and scenario 5 (train HBP → test HSL).
Information about the MSS is rendered in terms of hue brightness.
The width of the ellipses is equal to the width of the 95% confidence interval with reference to the given performance metrics.

About the authors & affiliations
Daniella Castro Araújoab*,
Adriano AlonsoVelosob,
Karina Braga Gomes Borgesc,
Maria das Graças Carvalhoc
a Huna, São Paulo, SP, Brazil
b Departamento de Ciência da Computação,
Universidade Federal de Minas Gerais, Belo Horizonte, MG, Brazil
c Faculdade de Farmácia,
Universidade Federal de Minas Gerais, Belo Horizonte, MG, Brazil
Stakeholders
We used datasets from two private Brazilian hospitals —
Hospital Sírio Libanês (HSL) and
Hospital Beneficência Portuguesa (HBP)their laboratory analyses are performed by the same company (Grupo Fleury).