


The Health Strategist
the blog of Joaquim Cardoso MSc
December, 2021
This is an excerpt of the paper below, with the title above, highlighting the case of Brazil, edited by the author of the blog.
Measuring universal health coverage based on an index of effective coverage of health services in 204 countries and territories, 1990–2019: a systematic analysis for the Global Burden of Disease Study 2019
GBD 2019 Universal Health Coverage Collaborators
August 27, 2020
GBD 2019 Universal Health Coverage Collaborators (top 10 names, in the list of appearance in the paper). Please, refer to the original publication for the complete list.
Rafael Lozano, Nancy Fullman, John Everett Mumford, Megan Knight, Celine M Barthelemy, Cristiana Abbafati, Hedayat Abbastabar, Foad Abd-Allah, Mohammad Abdollahi, Aidin Abedi, et all
SUMMARY
Background
Achieving universal health coverage (UHC) involves all people receiving the health services they need, of high quality, without experiencing financial hardship.
Making progress towards UHC is a policy priority for both countries and global institutions, as highlighted by the agenda of the UN Sustainable Development Goals (SDGs) and WHO’s Thirteenth General Programme of Work (GPW13).
Measuring effective coverage at the health-system level is important for understanding whether health services are aligned with countries’ health profiles and are of sufficient quality to produce health gains for populations of all ages.
Methods
Based on the Global Burden of Diseases, Injuries, and Risk Factors Study (GBD) 2019, we assessed UHC effective coverage for 204 countries and territories from 1990 to 2019.
Drawing from a measurement framework developed through WHO’s GPW13 consultation, we mapped 23 effective coverage indicators to a matrix representing health service types (eg, promotion, prevention, and treatment) and five population-age groups spanning from reproductive and newborn to older adults (≥65 years).
Effective coverage indicators were based on intervention coverage or outcome-based measures such as mortality-to-incidence ratios to approximate access to quality care; outcome-based measures were transformed to values on a scale of 0–100 based on the 2·5th and 97·5th percentile of location-year values.
We constructed the UHC effective coverage index by weighting each effective coverage indicator relative to its associated potential health gains, as measured by disability-adjusted life-years for each location-year and population-age group.
For three tests of validity (content, known-groups, and convergent), UHC effective coverage index performance was generally better than that of other UHC service coverage indices from WHO (ie, the current metric for SDG indicator 3.8.1 on UHC service coverage), the World Bank, and GBD 2017.
We quantified frontiers of UHC effective coverage performance on the basis of pooled health spending per capita, representing UHC effective coverage index levels achieved in 2019 relative to country-level government health spending, prepaid private expenditures, and development assistance for health.
To assess current trajectories towards the GPW13 UHC billion target — 1 billion more people benefiting from UHC by 2023 — we estimated additional population equivalents with UHC effective coverage from 2018 to 2023.
Findings
- Globally, performance on the UHC effective coverage index improved from 45·8 (95% uncertainty interval 44·2–47·5) in 1990 to 60·3 (58·7–61·9) in 2019,
- yet country-level UHC effective coverage in 2019 still spanned from 95 or higher in Japan and Iceland to lower than 25 in Somalia and the Central African Republic.
- Since 2010, sub-Saharan Africa showed accelerated gains on the UHC effective coverage index (at an average increase of 2·6% [1·9–3·3] per year up to 2019);
- by contrast, most other GBD super-regions had slowed rates of progress in 2010–2019 relative to 1990–2010.
- Many countries showed lagging performance on effective coverage indicators for non-communicable diseases relative to those for communicable diseases and maternal and child health, despite non-communicable diseases accounting for a greater proportion of potential health gains in 2019, suggesting that many health systems are not keeping pace with the rising non-communicable disease burden and associated population health needs.
- In 2019, the UHC effective coverage index was associated with pooled health spending per capita (r=0·79), although countries across the development spectrum had much lower UHC effective coverage than is potentially achievable relative to their health spending.
- Under maximum efficiency of translating health spending into UHC effective coverage performance, countries would need to reach $1398 pooled health spending per capita (US$ adjusted for purchasing power parity) in order to achieve 80 on the UHC effective coverage index.
- From 2018 to 2023, an estimated 388·9 million (358·6–421·3) more population equivalents would have UHC effective coverage, falling well short of the GPW13 target of 1 billion more people benefiting from UHC during this time.
- Current projections point to an estimated 3·1 billion (3·0–3·2) population equivalents still lacking UHC effective coverage in 2023, with nearly a third (968·1 million [903·5–1040·3]) residing in south Asia.
Interpretation
The present study demonstrates the utility of measuring effective coverage and its role in supporting improved health outcomes for all people — the ultimate goal of UHC and its achievement.
Global ambitions to accelerate progress on UHC service coverage are increasingly unlikely unless concerted action on non-communicable diseases occurs and countries can better translate health spending into improved performance.
Focusing on effective coverage and accounting for the world’s evolving health needs lays the groundwork for better understanding how close — or how far — all populations are in benefiting from UHC.
Funding
Bill & Melinda Gates Foundation.
ORIGINAL PUBLICATION (excerpted)
Research in context
See the original publication
Introduction
Universal health coverage (UHC) is viewed as a crucial avenue through which improved health for all can be attained,1, 2 by ensuring all people can receive quality health services they need, without experiencing financial hardship.
Global agendas and actors have amplified calls for UHC in recent years, driven at least in part by the explicit inclusion of UHC achievement in target 3.8 of the UN Sustainable Development Goals (SDGs)3, 4, 5 and heightened emphasis within recent UN resolutions1 and WHO programmatic objectives (eg, the target of 1 billion more people benefiting from UHC from 2018 to 2023 as part of WHO’s Thirteenth General Programme of Work [GPW13]).6, 7
Regional and country-driven efforts to elevate UHC on policy agendas have occurred as well, both building upon long established UHC programmes (eg, in Japan,8 much of western Europe,9, 10 and many countries in Latin America11, 12) and galvanising newer commitments to UHC implementation (eg, in India, Kenya, and South Africa).13
To better understand how actions and investments are delivering on the ultimate goal of UHC — improving health outcomes — it is essential to quantify and track trends in effective health service provision, as well as the extent to which advances in service coverage correspond with the potential health gains populations should experience.
In 2014, WHO and the World Bank published a UHC measurement framework in which service coverage was defined as a spectrum of services-promotion, prevention, treatment, rehabilitation, and palliation-across the life cycle.,
This framework emphasised the importance of providing services for individuals’ health needs throughout their lifespans and quantifying effective coverage of interventions delivered by health systems.
Conceptually, effective coverage unites intervention need, use, and quality into a single metric, representing the proportion of health gain that could be potentially received from an intervention relative to what is actually experienced.
At the health-system level, effective coverage aims to capture the fraction of total potential health gains actually delivered relative to what a health system could have theoretically delivered. To quantify such population-level health gains, Shengelia and colleagues outlined an approach to measure an aggregate of health-system effective coverage.
Effective coverage is a powerful measure: this metric not only demands accountability of intervention availability and use, but also requires that the services received are of sufficient quality to provide the health gains they are supposed to.
Yet in practice, effective coverage has to date been rarely measured, particularly across countries and over time.
Minimal uptake of effective coverage as a metric for UHC monitoring is at least partly due to data challenges, as most health data systems are not able to capture all three intervention components together (ie, need, use or receipt, and quality) and few data sources can adequately represent these dimensions for conditions involving more complex care (eg, cancer or stroke).
Tracer or proxy indicators of effective coverage exist for certain interventions or cause groups (eg, cancers), and recent health-system research by Kruk and colleagues used mortality-to-incidence rates to garner insights into health-care quality in low-income to middle-income countries.
Nevertheless, to date no multi-country UHC measurement effort to our knowledge has sought to estimate effective coverage across health service domains and population-age groups within a cohesive analytical platform.
Following the 2014 WHO/World Bank UHC monitoring framework and SDG adoption in 2015, several multi-country health service coverage indices have been developed to inform UHC measurement.19, 20, 21, 22, 23, 24, 25, 26
Although each effort has shown recognition of prevailing data limitations and challenges with operationalising UHC service coverage across myriad settings,21, 24 they each have limitations in how well they capture country-level trends and health service needs across the life course.17, 27, 28, 29, 30, 31
First, current indices primarily rely solely on household survey point estimates from multi-country survey series, which can lead to various measurement limitations (ie, being primarily focused on low-income to middle-income countries; restricted sets of interventions captured; and lags in data availability for understanding trends).
Second, most indices include either risk factor indicators (eg, prevalence of non-smoking and non-raised blood pressure in the UHC service coverage index,19, 20, 21 the SDG indicator 3.8.14) or health-system inputs or process indicators (eg, health workers per capita and hospital beds per capita in the UHC service coverage index; inpatient admission rates for Wagstaff and colleagues’ service coverage index23, 24), or both.
The use of such proxy indicators, as well as those influenced by factors outside the health system (eg, tobacco prevalence), for service coverage measurement could misattribute successes in health service provision or misrepresent UHC service coverage.
With non-communicable diseases accounting for at least 60% of early death and disability worldwide,32 the omission of non-communicable disease indicators beyond risk factor prevalence proxies or cancer screening is at odds with the reality of countries’ populations and health systems.
Third, approaches used to construct overall indices of UHC service coverage typically involve somewhat arbitrary weighting schemes (eg, a series of geometric means4, 19, 20, 21 or weighted geometric means23, 24), and thus might not capture the alignment of services provided given a country’s health and demographic profile.
Last, none of these approaches explicitly accounts for the potential health gains delivered through the health system, a limitation that inhibits our collective understanding of whether or how gains in UHC are improving health outcomes for all.
Recent developments from WHO indicate a revived interest in using effective coverage for UHC monitoring; these include the WHO GPW13 Expert Reference Group (ERG) Task Force on Metrics recommendations on effective service coverage measurement33 and the WHA72 resolution recommending country pilots on monitoring UHC effective coverage.7
The GPW13 ERG also supported initial efforts to map health services against population-age groups within a measurement framework and to identify indicator options across the life course in order to estimate UHC effective coverage across countries.33
The present analysis contributes to this endeavour through the Global Burden of Diseases, Injuries, and Risk Factors Study (GBD) 2019, mapping 23 effective coverage indicators across health service types and population-age groups for 204 countries and territories from 1990 to 2019.
Based on the construct of health-system effective coverage, we aggregated individual effective coverage indicators to produce an overall index using health gain weights, which were derived from country-specific disease burden estimates relative to theoretical levels of burden avertable given intervention levels and associated effectiveness.
We compared the performance of this UHC effective coverage measure against that of previous multi-country UHC service coverage indices21, 24, 26 on a series of validity tests.
We then assessed the relationships between pooled health spending per capita and index performance, aiming to capture how close — or how far — countries were in reaching UHC effective coverage frontiers relative to their current spending.
Finally, we considered applications of this index for current global and national UHC priorities, such as translating index performance to the number of people covered by effective coverage for the GPW13 UHC billion target.
Methods
See the original publication
RESULTS
National UHC effective coverage patterns in 2019
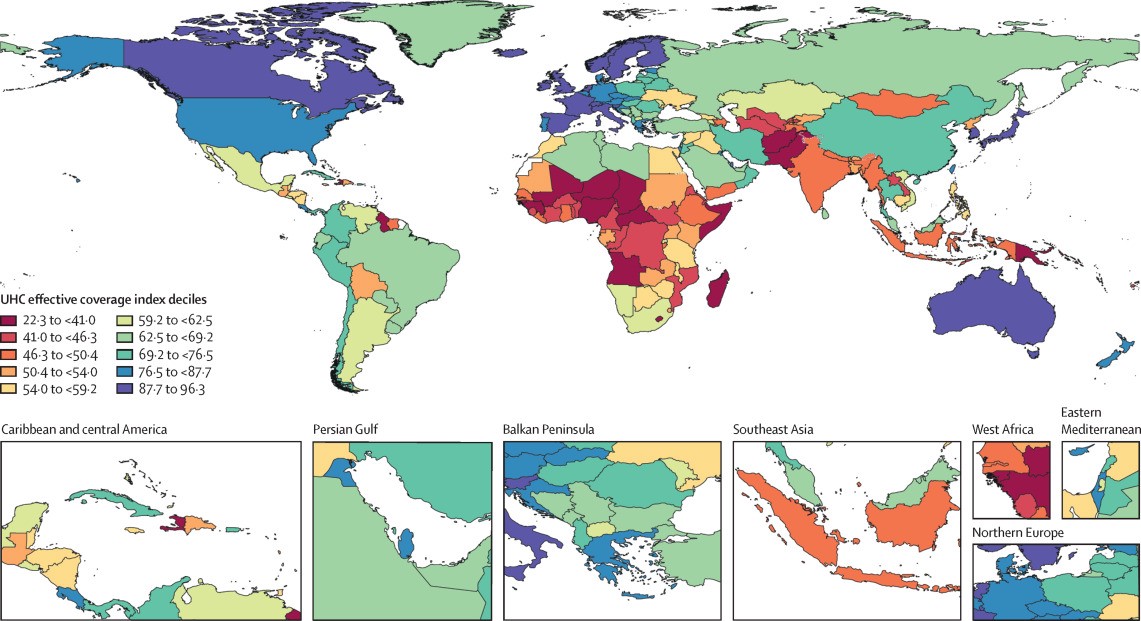
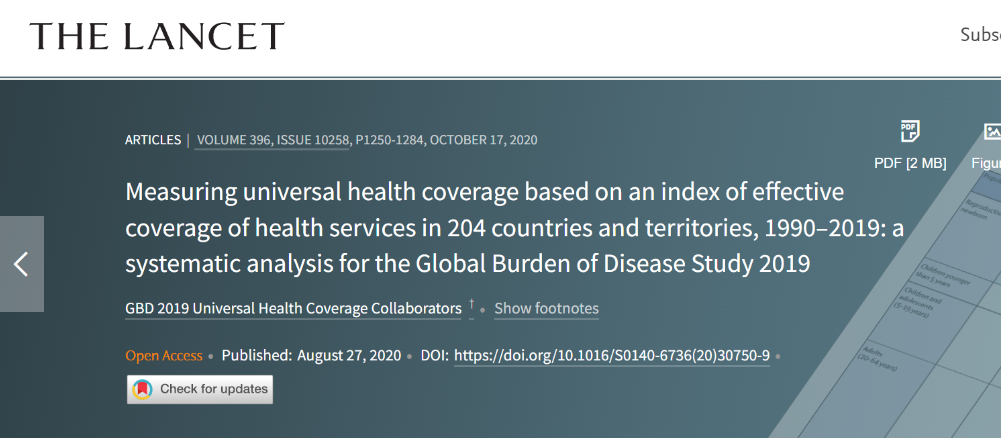
In 2019, UHC effective coverage performance showed some strong geographical patterns (figure 3), but sizeable heterogeneities also emerged.
Figure 3 Map of the UHC effective coverage index, by decile, in 2019
Various European countries, including Iceland, as well as Australia, Canada, Japan, Singapore, and South Korea, comprised the highest decile,
followed by a more geographically diverse group in the ninth decile (eg, Costa Rica, Israel, New Zealand, Portugal, and the USA). ]
Sub-Saharan Africa had among the widest range of UHC effective coverage performances in 2019, with two countries ranking in the sixth decile (Rwanda and South Africa) and 11 countries in the first decile; the countries in the first decile were mainly in western or central sub-Saharan Africa, but also spanned the continent (eg, Angola, Lesotho, Madagascar, and Somalia).
Outside of sub-Saharan Africa, ten countries, including Afghanistan, Haiti, Pakistan, and Papua New Guinea, were also in the lowest decile in 2019.
In east, southeast, and south Asia, countries largely fell between the eighth (China and Thailand) and second deciles (Laos), with India and Indonesia occupying the third decile.
Within Latin America, various countries scored in the eighth or seventh deciles (eg, Chile, Colombia, Peru, and Brazil) but others saw UHC effective coverage index values within the fourth to fifth deciles (eg, Bolivia, Guatemala, and Nicaragua).
Performance on the overall UHC effective coverage index often corresponded with levels achieved across individual effective coverage indicators (figure 4); for instance, countries with effective coverage index values of 85 or higher generally had the vast majority of effective coverage indicators exceeding 80.
Although high-performing locations usually had lower values for at least some subsets of indicators (eg, met need for family planning or antiretroviral therapy coverage), such indicators often represented areas of lower potential health gains — especially relative to effective coverage indicators proxying health services or interventions for conditions with higher potential health gains in these countries (eg, cardiovascular diseases, cancers, and diabetes).
Countries and territories with fairly low overall UHC effective coverage index performance in 2019 (ie, <40) scored similarly low across most effective coverage indicators, although vaccine coverage and proxies for lower respiratory infection and diarrhoea treatment were among the main exceptions.
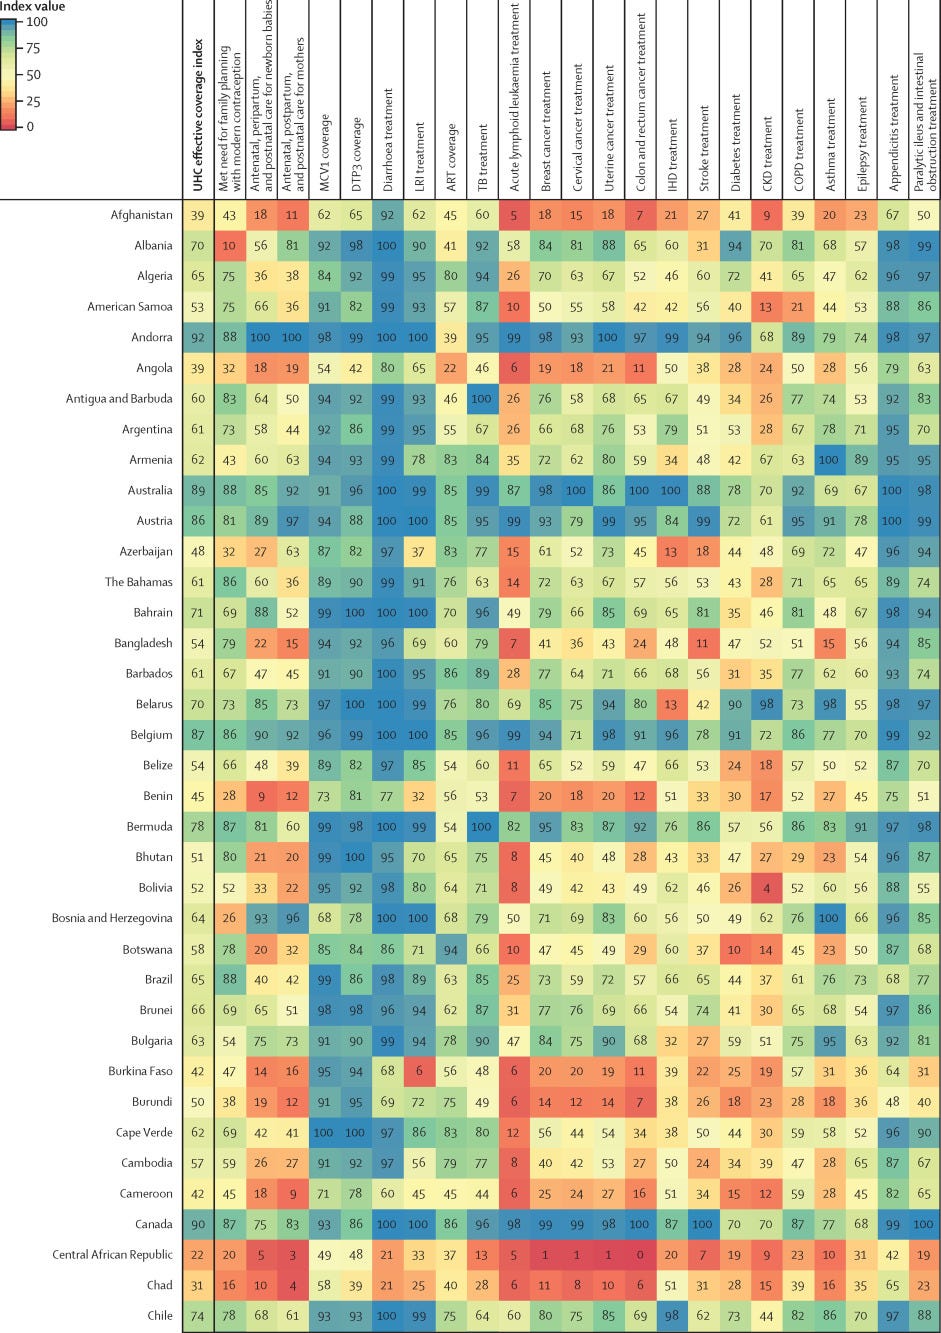
Figure 4Performance on the UHC effective coverage index and 23 effective coverage indicators, by location, in 2019
Note from the Editor of the excerpted version: For other countries, see the original publication.
Many countries with middle-range performance on UHC effective coverage (ie, about 45–70) in 2019 had a mixture of fairly high values on most indicators for communicable diseases and reproductive, neonatal, maternal, and child health but comparatively lower scores on many non-communicable diseases, likely mirroring their variable epidemiological profiles and thus populations’ health needs.
For some countries, especially those in sub-Saharan Africa (eg, Namibia, Rwanda, and Kenya), communicable diseases (eg, HIV) and reproductive, neonatal, maternal, and child health still ranked among indicators with highest potential health gains in 2019, even though non-communicable diseases such as cardiovascular diseases and diabetes are on the rise. 35
With their fairly high levels of coverage or services proxied by effective coverage indicators for communicable diseases and for reproductive, neonatal, maternal, and child health, several of these countries had higher UHC effective coverage index performance under a health gains weighting approach than under the assumption that each effective coverage indicator could deliver equal health gains to populations across different settings (figure 2).
By contrast, in many other countries — especially those in Latin America, central and eastern Europe, and Oceania — non-communicable diseases accounted for a greater proportion of potential health gains by 2019; consequently, these countries’ relatively poor performances on several effective coverage indicators proxying non-communicable disease services underpinned lower overall UHC effective coverage index values.
High levels of vaccine coverage and performance on effective coverage indicators such as maternal care still contributed to UHC effective coverage performance for such countries; however, these health areas generally represented a smaller fraction of population-level health gains than many non-communicable diseases in these settings. Health gain weights, by country and territory, for each effective coverage indicator are available in the appendix 2 (pp 11–13) and via online data tools.
Pace of progress on UHC effective coverage
Since 1990, UHC effective coverage performance improved, albeit at variable rates of progress over time and across GBD super-regions (figure 5).
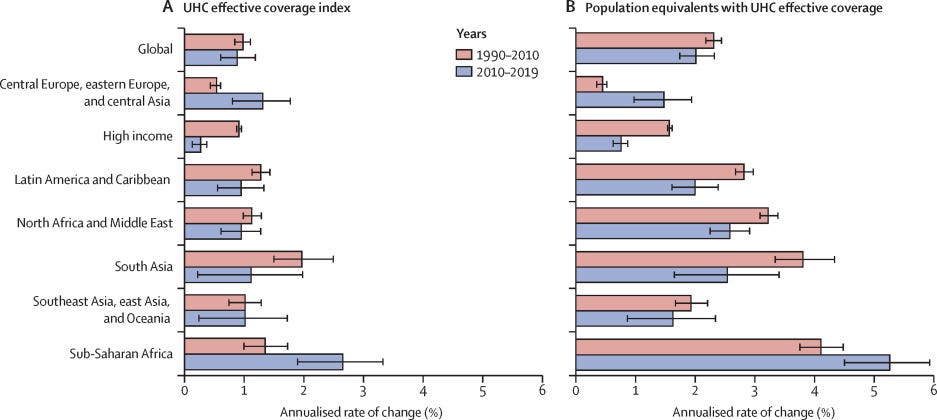
Figure 5 Annualised rate of change in the UHC effective coverage index (A) and population equivalents with UHC effective coverage (B), globally and by GBD super-region, 1990–2010 and 2010–2019
The global average increased from 45·8 (95% UI 44·2–47·5) in 1990 to 60·3 (58·7–61·9) in 2019, while the absolute range in performance essentially remained the same (ie, 73·0-point difference in 1990 vs 74·0-point difference in 2019).
By 2019, the UHC effective coverage index spanned from 95 or higher in Japan (96·3 [95·0–97·4]) and Iceland (95·3 [93·6–96·8]) to lower than 25 in the Central African Republic (22·3 [16·3–29·3]) and Somalia (23·9 [17·1–31·1]; appendix 2 pp 14–20).
Globally, the pace of progress on UHC effective coverage was somewhat slower, albeit not significantly, from 2010 to 2019 (0·9% [0·6–1·2] annualised increase) than from 1990 to 2010 (1·0% [0·8–1·1] annualised increase).
Similarly, at the global level, annualised rates of change for population equivalents with effective coverage were slightly lower from 2010 to 2019 (2·0% [1·7–2·3]) than from 1990 to 2010 (2·3% [2·2–2·4]), although this difference was not significant.
However, some of these patterns diverged by GBD super-region (figure 5), as well as at the country level (appendix 2, pp 14–20).
For instance, in sub-Saharan Africa, UHC effective coverage index performance improved at an average of 2·6% (1·9–3·3) per year from 2010 to 2019, surpassing its annualised rate of change from 1990 to 2010 (1·3% [1·0–1·7] average increase per year).
Central Europe, eastern Europe, and central Asia also had significantly faster progress from 2010 to 2019 (1·4% [0·8–1·8] average annual increase) than from 1990 to 2010 (0·5% [0·4–0·6] annual increase).
Relationship between health expenditure and UHC effective coverage
Country-level performance on UHC effective coverage widely varied across different levels of pooled health spending per capita (figure 6), highlighting how increased health spending is necessary but insufficient on its own to improve UHC effective coverage.
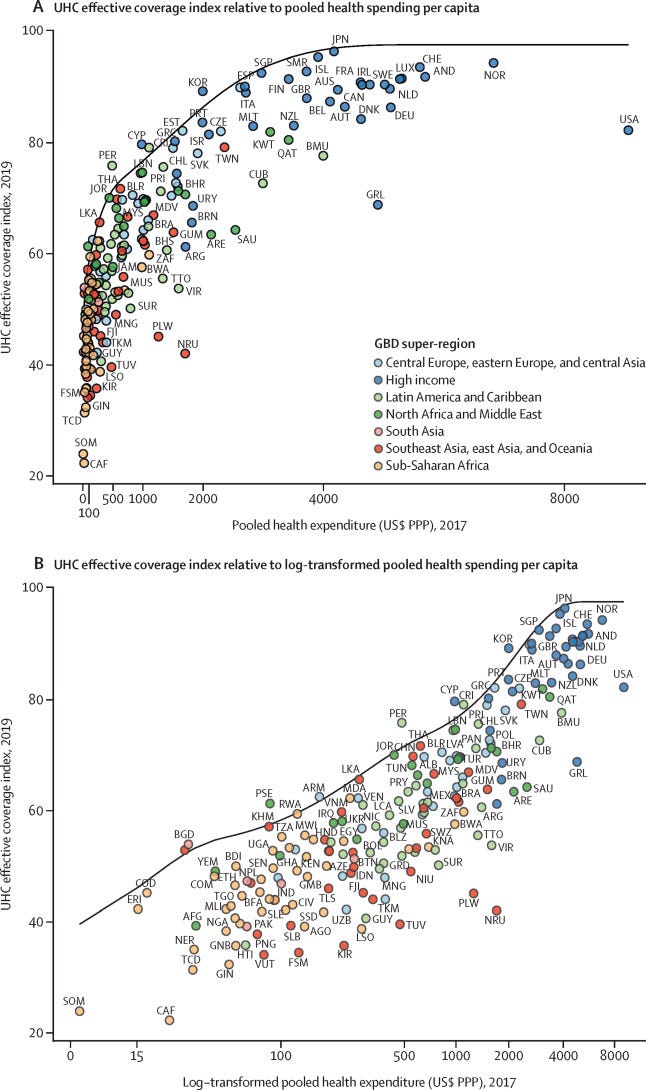
Figure 6 UHC effective coverage index frontier relative to pooled health spending per capita (A) and log-transformed pooled health spending per capita (B)
Overall, the UHC effective coverage index was associated with pooled health spending per capita (r=0·79), but this relationship was varied at different levels of spending.
Up to about $2500 (US$, adjusted for purchasing power parity) in pooled health spending per capita, increasingly higher expenditures generally paralleled higher performance on UHC effective coverage index;
beyond that, higher expenditures did not correspond as consistently with further improvements in UHC effective coverage performance.
The UHC effective coverage frontier charts the highest UHC effective coverage performances, as achieved by countries in 2019, across different levels of pooled health spending per capita (figure 6); in other words, this frontier represents the relative efficiency — or inefficiency — with which countries could translate their health spending into improved UHC effective coverage.
Countries including South Korea, Cyprus, Costa Rica, Peru, and Rwanda were among those setting this performance frontier at their corresponding levels of pooled health expenditure per capita.
Conversely, countries across the sociodemographic spectrum (ie, Central African Republic, Lesotho, Turkmenistan, Saudi Arabia, and the USA) showed large gaps between their estimated UHC effective coverage index performances in 2019 and what could have been achievable on the UHC effective coverage frontier given these countries’ levels of pooled health spending.
To reach a UHC effective coverage index of at least 80, under maximum efficiency, countries would need to reach US$1398 in pooled health spending per capita (per year).
Equivalent analyses and figures for total health expenditure per capita (ie, pooled health spending plus out-of-pocket spending) and pooled domestic health expenditure per capita (ie, pooled health spending minus development assistance for health) are provided in appendix 2 (pp 6–7).
Counting population equivalents with effective coverage for the UHC billion target
Based on current projections, an estimated 5·0 billion (95% UI 4·8–5·1) population equivalents would have UHC effective coverage in 2023 (table 3).
This would translate to 388·9 million (358·6–421·3) more population equivalents with UHC effective coverage over the five-year GPW13 evaluation period (2019–23, with 2018 as the baseline), or the equivalent of adding an average of 77·8 million (71·7–84·3) population equivalents per year during this time.
From 2018 to 2023, sub-Saharan Africa was estimated to contribute the most additional population equivalents with UHC effective coverage (ie, 94·5 million [83·6–104·8]).
By 2023, an estimated 3·1 billion (3·0–3·2) population equivalents would not have UHC effective coverage, with nearly a third residing in south Asia (ie, an estimated 968·1 million [903·5–1040·3]).
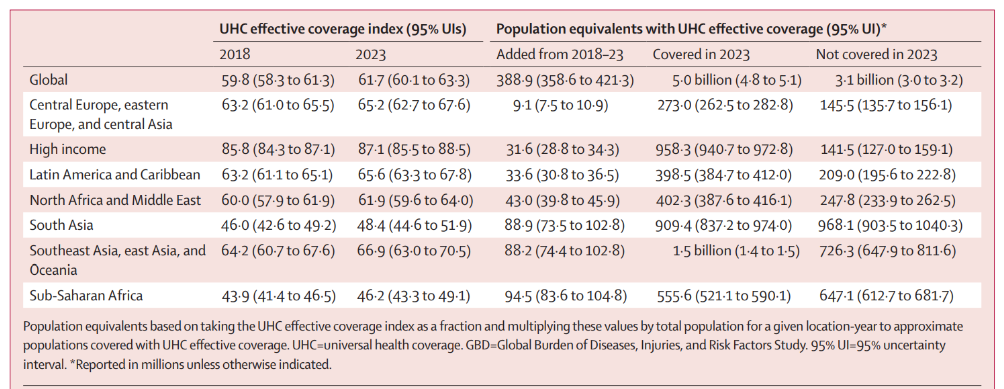
Table 3 Projected UHC effective coverage performance in 2023 and additional population equivalents with UHC effective coverage from 2018 to 2023, globally and by GBD super-region.
DISCUSSION
Summary of the main findings
The present study offers a new approach to monitoring progress on UHC service coverage: measuring country-level effective coverage and thus better representing how well health systems are delivering health gains relative to their populations’ health needs.
Amid global advances on the UHC effective coverage index since 1990, our findings show a gap of more than 70 points between locations with the highest and lowest levels of UHC effective coverage remained in 2019.
Particularly among low-middle to middle-SDI countries, performance of effective coverage indicators for non-communicable diseases was far lower than levels reached for several communicable diseases and maternal and child health indicators — a pattern suggesting that many countries’ health systems and financing priorities are not moving as quickly as their epidemiological and demographic transitions.
Higher pooled health spending per capita generally corresponded with higher UHC effective coverage.
Nonetheless, country-level performance varied widely and many countries fell well below levels achieved by other countries with similar amounts of health expenditures, emphasising the importance of increasing both health-system efficiencies and funding for UHC.
To achieve at least 80 on the UHC effective coverage index, countries would need to reach $1398 pooled spending per capita — and do so under maximum efficiency.
An estimated 388·9 million more population equivalents would have UHC effective coverage between 2018 and 2023, falling well short of the GPW13 target of 1 billion more people benefiting from UHC during this time.
Genuinely advancing toward UHC requires prioritising — and thus monitoring — effective coverage and health systems’ capacities for improving outcomes for all people throughout the world.
Past progress, current challenges, and accelerating future gains on UHC effective coverage
By 2019, UHC effective coverage improved substantially for many countries, and for some countries the pace of progress has accelerated since 2010. This was particularly evident in sub-Saharan Africa; this GBD super-region nearly doubled its average annual improvements from 2010 to 2019 compared to 1990–2010. Such gains could be related to heightened funding — and thus prioritisation — for HIV, vaccines and childhood infectious diseases, and maternal health during the Millennium Development Goal (MDG) era.61, 62 As further illustrated by the UHC effective coverage frontier, up to about $2500 per capita, rising levels of UHC effective coverage index generally paralleled pooled health spending; this trend highlights the important role of increasing funding for UHC to jumpstart progress, particularly for countries that still have very low UHC effective coverage in 2019. Yet even at the frontier, reaching better UHC effective coverage performance requires much higher pooled health spending per year: an estimated $1398 per capita to reach 80, and then $2538 per capita to reach 90 and $3424 per capita to reach 95. At present, the only countries achieving 90 or higher on the UHC effective coverage index and such levels of pooled health spending per capita are within the high-income GBD super-region. Substantially increasing total health spending could be one avenue for elevating UHC effective coverage performance; however, many countries still have high out-of-pocket spending relative to their total spending,56, 61 which is strongly related to household catastrophic health expenditures and directly counter to improving financial risk protection within UHC. Focusing on domestic heath spending while also elevating efficiency could be another viable route; our results show that many countries would theoretically achieve much higher UHC effective coverage if they could better translate current amounts of pooled spending per capita into improved performance. How to best address such inefficiencies will markedly vary across contexts, and will require accounting for country-level differences in health-system orientations and structures, political stability and governance systems, and distribution of health resources among populations. Further examination of approaches used by countries near or at the UHC effective coverage frontier relative to their pooled health spending (eg, Rwanda, Peru, South Korea, and Costa Rica) might help identify tractable policy pathways to improved efficiency.
Poor performance on various non-communicable diseases has severely hindered progress on UHC effective coverage in many countries — a trend that is likely to only worsen until quality health services for non-communicable diseases are better prioritised by countries and development partners alike. Especially among low-middle SDI to middle-SDI countries, earlier advances on UHC effective coverage were mainly propelled by improving health services focused on communicable diseases, child health, and maternal care. As cardiovascular disease, diabetes, cancers, and other non-communicable diseases became leading causes of early death and disability, they also emerged as population health needs with the highest potential health gains — that is, where health systems could increasingly deliver the most improved outcomes via effective coverage of interventions and services. Re-orienting countries’ health systems towards providing effective health services for non-communicable disease is not trivial, especially if their prior focus (and funding) had a more limited scope for the types of services provided, equipment used, and health workforce training required. However, continued inaction also has likely costs: if health systems remain too focused on health problems of the past, and fail to effectively respond to where the largest potential health gains exist today, it can be increasingly difficult to translate current levels of health spending into improved UHC effective coverage. For instance, only a few high-SDI countries (eg, Japan, Switzerland, and South Korea) averaged non-communicable disease performance equal to or higher than effective coverage indicators focused on communicable diseases and maternal and child health by 2019.63 Unless deliberate efforts are taken now to recalibrate health-system and funding priorities, the ability to alter current trajectories for UHC effective coverage could diminish.
To catalyse faster gains in the SDG era, WHO’s GPW13 set forth its bold billion targets,6 with the UHC target calling for 1 billion more people benefiting from UHC by 2023, relative to 2018. Current projections have the world falling well short of this ambition, with an estimated 388·9 million (358·6–421·3) more population equivalents having UHC effective coverage by 2023. Even these estimates are likely to be optimistic, as they do not account for trends in financial risk protection — the other key dimension of UHC — nor do they explicitly account for populations’ needs for multiple health services. Nonetheless, this initial assessment offers important considerations for the remaining years of GPW13 and then through to 2030. With more than 3 billion population equivalents estimated to lack UHC effective coverage in 2023, targeting populous regions or countries that currently have low UHC effective coverage and investing in service expansion could be one option to accelerating future progress. For instance, south Asia, in combination with southeast Asia, east Asia, and Oceania, was estimated to have nearly 1·7 billion population equivalents without UHC effective coverage in 2023. However, on the basis of current levels of health spending, many countries in these regions already fell below their potential UHC effective coverage performance in 2019. For most countries, heightened health spending alone is unlikely to deliver on ambitious UHC targets; rather, a combination of improving alignment of health systems with population health needs and bolstering efficiencies is likely to chart faster and perhaps more sustained gains.
Current challenges and future directions for measuring UHC effective coverage
Our measurement framework is grounded in the construct of effective coverage at the health-system level,16 aiming to represent a country’s ability to improve health outcomes in accordance with the health needs and disease burden of its population.
From this perspective, effective coverage should capture the fraction of potential population-level health gains actually delivered by the health system, relative to what the health system could have provided at maximum performance of current interventions or services.
As such, we used health gain weights to construct the overall UHC effective coverage index and to more heavily weight effective coverage indicators for which a given country’s health could produce greater health gains through available interventions.
By contrast, the unweighted average of effective coverage indicators implies equal potential health gains irrespective of a country’s epidemiological profile or effectiveness of the associated interventions or services, or a combination of both.
Equally weighting interventions and their potential for improving health is directly counter to the reality of UHC programmes, which are subject to each country’s unique health-system structures, political demands, and health priorities. T
To capture what can — or should — be achievable through health systems’ provision of effective services, we believe the health gains weighting approach can better track country-led UHC investments and policy implementation.
Going forward, assessments of UHC effective coverage should strive to apply this method beyond the national level, aiming to capture inequalities in potential health gains not only by location but also within population-age groups, by sex, and across other important sociodemographic dimensions (eg, race/ethnicity and migrant status).
Routinely measuring UHC effective coverage requires the existence and maintenance of several functional data systems.
Many, if not most, indicators or data systems, or both, that are needed to measure effective coverage indicators are already encompassed within the health-related SDGs, which UN member states have committed to monitoring.
These include functional vital registration systems that
- accurately record causes of death;
- periodic household surveys that include biomarker data and information on intervention coverage; and
- disease incidence registries based on administrative systems and notifications for specific causes (eg, cancers and kidney disease).64
Deliberate investments by national governments, as well as international agencies where appropriate, are important for strengthening these data systems and identifying how they can be used together to monitor trends in effective coverage.
The UHC effective coverage index and corresponding UHC effective coverage measurement framework represent important steps towards capturing a range of needed health services across the life course; nonetheless, as underscored by its multi-year development process (appendix 1 pp 6–21), considerable gaps persist between the breadth of the original candidate effective coverage indicators and those used in the present analysis.
Minimal data on rehabilitative services and palliation across countries and over time hindered their direct inclusion or the use of suitable proxy effective coverage indicators.
Recent steps by WHO (ie, publishing its first world report on vision65 and upcoming report on hearing,66 and its GPW13 indicator on oral morphine availability6) suggest that data collection for these areas could be increasingly prioritised.
A similar paucity of routinely collected data on mental health services and substance use disorder interventions precluded their use in the current UHC effective coverage index.
In the future, triangulation of data sources including administrative records, health facility records, and community-based surveys might inform such measurements.67
Effective coverage indicators on emergency services and trauma care were also considered but ultimately excluded because of data limitations and ongoing methodological challenges (ie, appropriately isolating improvements in effective health services from advances in transportation safety).
For non-communicable diseases, we relied on outcome-based effective coverage indicators, preferring to approximate access to quality non-communicable disease care through measures such as MIRs rather than assuming that risk exposure, screening rates, or health-system inputs, or a combination of these factors, can appropriately capture effective service provision for non-communicable diseases. Many national data systems already collect data on cause-specific mortality and disease incidence or prevalence, and when analysed together they should reflect variations in access to and quality of health services and serve as good proxy measures amid imperfect data realities for non-communicable disease services. Conversely, using indicators such as non-tobacco use and non-elevated blood pressure4, 19, 21 or inpatient admission rates pushes the world further away from understanding improved outcomes delivered by health systems and effective service provision. If, or when, the quantity and quality of data for measuring health services for non-communicable diseases improve, we would prefer to use more direct measures of effective coverage over outcome-based proxy indicators. For instance, our ideal effective coverage indicator for diabetes treatment would be the proportion of people with diabetes on treatment and meeting specified treatment targets such as glycated haemoglobin lower than 8%. Household surveys such as the WHO STEPwise approach to surveillance (STEPS) are increasingly collecting these data, and time series estimates by location and population-age group could be easily derived if sufficient access to such microdata is possible.
In sum, the indicators included in the present study are not meant to be prescriptive; rather, our primary objective was to establish a robust, comparable measurement framework from which UHC effective coverage could be assessed across settings and inform efforts to incorporate effective coverage into UHC monitoring.
Continuing to advance effective coverage measurement of UHC in the future, especially if the main alternative is adhering to past measures with known drawbacks and narrow operationalisations of health services for all populations, is strongly supported by the broader GBD study and its collaborators.
Limitations
Note from the Editor: See the long version of the original publication.
Conclusion
This study provides a new measurement framework and metric on UHC effective coverage, supporting country and global stakeholders in their efforts to track improved performance over time.
By striving to capture potential health gains delivered by health systems, we hope to better diagnose and address challenges that otherwise impede the ultimate objective of UHC: improving health for all people and leaving no one behind.
If current trends hold, the world will fall short of delivering on its UHC ambitions for the GPW13 and SDGs.
Although this outcome is not yet inevitable, the window for meaningful action and health-system changes is rapidly narrowing.
By focusing on UHC effective coverage and populations’ health needs across the lifespan, we strengthen the evidence base for bringing UHC closer to reality for all.
GBD 2019 Universal Health Coverage Collaborators
Rafael Lozano, Nancy Fullman, John Everett Mumford, Megan Knight, Celine M Barthelemy, Cristiana Abbafati, Hedayat Abbastabar, Foad Abd-Allah, Mohammad Abdollahi, Aidin Abedi, et all
Originally published at https://www.thelancet.com.