


This is a republication of the paper below, with the title above, focusing highlighting the message in question.
Analytical Solutions to Support Value-based Health Care: The Ischemic Stroke Care Pathway Case
An international multidisciplinary team developed an innovative business intelligence platform using data from three Brazilian hospitals that integrates (1) patient-reported outcome measures and (2) time-driven activity-based costing data (TDABC) — in a process that ensures clinical and business utility and enables scalability in promoting value-based health care delivery [including also (3) risk level and (4) type of therapy]
NEJM Catalyst
Ana Paula Beck da Silva Etges, PhD, Eng, Junaid Nabi, MD, MPH, Anne Geubelle, MBA, Sheila Ouriques Martins, MD, PhD, and Carisi Anne Polanczyk, MD, ScD
February 18, 2022
This site version was edited by:
Joaquim Cardoso MSc.
health transformation . institute
vbhc unit
July 31, 2022
Summary
- The development of information technology –based solutions represents a timely opportunity to make the adoption of value-based health care programs feasible worldwide.
- This article introduces the strategic considerations of designing and deploying a business intelligence (BI) platform that automates analytics capability — using real-world data — for value-based health care endeavors.
- A stroke care management pathway was selected as the reference case to develop the platform using data from 822 patients hospitalized in three centers in Brazil.
- The ICHOM Standard Set for stroke and the Angel Awards indicators were used for outcome measures collection.
- The time-driven activity-based costing (TDABC) method was used to estimate the cost per patient.
- Patients were classified into risk levels based on their clinical conditions to guide the value analyses.
- The value assessment BI platform was developed with PowerBI technology.
- The project was developed by a multidisciplinary team of neurologists, epidemiologists, data analysts, and industrial engineers.
- The BI includes four different views:
(1) general sample characterization, and evaluation comparing each hospital by
(2) outcomes and costs,
(3) risk level, and
(4) type of therapy.
- The analytics interface was designed with stakeholder input for ease of use, can be updated in real time, and can be adapted for other clinical and business use cases.
- The solution enables the opportunity for financial and clinical insights about the care pathway with clinicians and managers at the hospital and represents a novel approach to facilitate, standardize, and accelerate the implementation of value-based health care programs using real-world data.
Selected image:
ORIGINAL PUBLICATION (full version)
Analytical Solutions to Support Value-based Health Care: The Ischemic Stroke Care Pathway Case
NEJM Catalyst
Ana Paula Beck da Silva Etges, PhD, Eng, Junaid Nabi, MD, MPH, Anne Geubelle, MBA, Sheila Ouriques Martins, MD, PhD, and Carisi Anne Polanczyk, MD, ScD
February 18, 2022
Introduction
Health systems around the world have registered a continuous increase in health care expenses and waste, and more spending has not necessarily been associated with better population health.[1] [2]
Motivated by that context, the search for health care management improvement and a strategy of excellence based on competition have emerged with the implementation of value-based health care (VBHC) worldwide.[3]
To guide VBHC adoption, a value agenda was introduced, including the development of information technology solutions as a basis to enable and implement five mutually reinforcing elements (integrated practice units, measurement of outcomes and costs for every patient, bundled payments for care cycles, integrated care delivery systems, and expanded geographic reach).[4]
The digital transformation and the use of real-world data and evidence in health care can be a positive disruptive force and is the trigger for making it more effective by contributing to delivering more accurate information to support assertive decisions.
In this context, in 2021, the World Health Organization (WHO) launched a framework for the adoption of digital health strategies, including four major objectives:
(1) to promote global collaboration and advance the transfer of knowledge on digital health;
(2) to advance the implementation of national digital strategies;
(3) to strengthen governance for digital health at global, regional, and national levels; and
(4) to advocate people-centered health systems that are enabled by the use of digital health.
It is expected that adopting the framework will accelerate the digitization of health care with responsibility and compliance, resulting in a healthier population and more efficient and value-oriented systems.[5]
However, while information-technology capacity is a requirement to transform the health care system, it also represents a great challenge to scale value-based management programs in the health care industry.[6] [7]
Advances in solutions that allow the use of real-world data on patient-reported outcome measures (PROMs) and costs to generate on-time evidence are necessary to sustain health care decisions on value.
It is necessary to advance digital solutions that automate outcomes and cost data collection and analyses, serving as management tools to guide value-reimbursement strategies with compliance.[8] [9]
Here, we introduce an innovative business information platform that uses real-world data to automate analytics capability to enable health management decision-making for value-based health care organizations.
We describe the development and deployment of the platform and underscore the importance of using digital technology for health system transformation.

The Stroke Care Pathway in Brazil
Stroke is among the leading causes of death in Brazil and worldwide.[10] In 2008, the Brazilian Stroke Network (Rede Brasil AVC) — which includes more than 190 hospitals — was created to improve the quality of care delivered to ischemic stroke patients.
Major accomplishments by this initiative include the implementation of stroke care units in numerous hospitals, establishing minimum qualifications for teams that manage stroke patients, use of PROMs to better evaluate the quality of care, and adoption of an international award program for stroke centers (the Angels Awards) that classify hospitals based on assistance quality indicators.
These advances have significantly contributed to guiding clinical and treatment decisions for the stroke care pathway.[11] [12]
“Following the value agenda elements, we had sufficient program duration and data from this study to assess the outcomes that matter to patients for two of the three hierarchy levels: health care status achieved (Tier 1) and process of care cycle and recovery (Tier 2).”
Data Access and Stroke Centers Research
For this article, we included data from three Brazilian hospitals, one private (Hospital A) and two public (Hospitals B and C), which are all tertiary-care stroke centers in Brazil.
All three hospitals are included in the Angel Awards Program and, as a result, they have previously established a routine pathway to monitor ischemic stroke patient outcomes, such as those determined by the program, and have included the measures suggested by the International Consortium for Health Outcomes Measurement (ICHOM) Stroke Standard Set.
However, the clinical and outcomes data collected are registered in several Excel spreadsheets, and the administrative data are stored in individual hospital electronic systems; there is no routine practice of integrating these databases for stroke care management.
To address this lack of robust analytic capacity, this study was approved by the IRB from the Hospital Moinhos de Vento (CAAE: 29694720.0.0000.5330).
Patient-Reported Outcome Measures
Following the value agenda elements,[13] we had sufficient program duration and data from this study to assess the outcomes that matter to patients for two of the three hierarchy levels: health care status achieved (Tier 1) and process of care cycle and recovery (Tier 2).[14]
For health care status, validated scores to evaluate clinical stroke outcomes were used, including the modified Rankin Score (mRS)[15] and the National Institutes of Health Stroke Scale (NIHSS) scores,[16] in addition to general outcomes, such as mortality, hospital length of stay, and infections.
For the recovery process and PROMs, the ICHOM standard set developed for ischemic stroke was used,[17] and it included a measure for mobility, ability to communicate, and self-care.
Finally, quality indicators of the process of care were included, using the Angel Awards measures as a reference.[18]
The time between patient arrival and brain imaging and the time between patient arrival and reperfusion therapy were also recorded.
For each indicator, a goal was established considering the literature on expected outcomes and experts’ opinions.
All indicators were standardized, ranging from 0%–100%, to parameterize the indicator in the same unit[19] and, sequentially, to evaluate the performance of each group from the sample of patients on each indicator.
Cost Estimates
Costs were estimated by applying time-driven activity-based costing (TDABC) methodology, so the costs of all resources used to treat a patient’s medical condition over a complete cycle of care were measured.[20]
TDABC extended the activity-based costing method from accounting literature to implement, update, and scale cost information in health care delivery without losing accuracy and transparency.[21]
In a complex environment that involves multiple processes and departments, such as health care, TDABC enables more accurate cost estimates in care spending, specifically because it uses two evidence-based parameters:
(1) the unit cost of resource inputs, and
(2) the time and quantity of resources required to perform a transaction or an activity.
It has been applied in several micro-costing, care pathway, and reimbursement redesign studies following VBHC principles in the last few years.[22] [23]
TDABC application in this study followed the methodological orientations for health care use as described before in academic literature.[24] [25]
For all patients, the prices and amounts of materials, devices, and medications were taken from invoices and documents containing acquisition costs, excluding profit margins.
The exams were also collected individually for each patient by identifying those included in the electronic health records and considering the cost per exam of each institution.
Categorization of Clinical Conditions
Patients were categorized into groups according to the therapy prescribed, the clinical risk level (low, medium, and high), and the mRS category (0–2; 3–4; 5–6).
The clinical risk level was attributed based on patient age and NIH Stroke Scale score (NIHSS) at arrival.
The low-risk category included patients under 70 years with an NIHSS score lower than 8; medium-risk included patients under 70 years with an NIHSS score between 8 and 15 and patients older than 70 years with an NIHSS score lower than 8; and high-risk included patients older than 70 years with an NIHSS score higher than 8 as well as patients of any age with an NIHSS score higher than 15.
Regarding the NIHSS stratification, the scale criteria to classify the risk level were the same as those used by Muchada et al. (2014).[26]
“This BI platform has a variety of different views that are dynamic and interact with each other, which offers an easier and more engaging way to interpret the outcome results.”
Business Intelligence Platform Development
The business intelligence (BI) platform was developed with Prologica SA, a Portuguese health-data solution provider, as part of this initiative to demonstrate how to automate the assessment of value in health care delivery with real-world data.
Because the analytics strategy was to demonstrate the relationships among the clinical condition at arrival, PROMs, and costs, we defined and calculated approximately 30 indicators and categories.
Two different software programs were used to prepare the database and to build the BI platform — Microsoft Excel and Microsoft PowerBI (Redmond, Washington, USA).
Data-feeding was conducted through the Excel platform, which was also used for preliminary analysis; PowerBI enabled the subsequent dynamic changes in the data structure, as well as the calculation of the indicators.
Health care organizations intending to develop and implement similar solutions can deploy structured Excel sheets by populating them with PROMs and cost estimates — with the advantage of the dashboard being updated in real time.
After the data reconstruction was complete, the development team used Microsoft PowerBI to assemble the final dashboard.
To achieve a better understanding of how the patient’s clinical data can be related to the PROMs and costs, the dashboard was divided into four different views.
The first view (Figure 1) of the data was characterized in terms of age and sex, hospital distribution, and risk factors and risk levels, representing a sample description view.
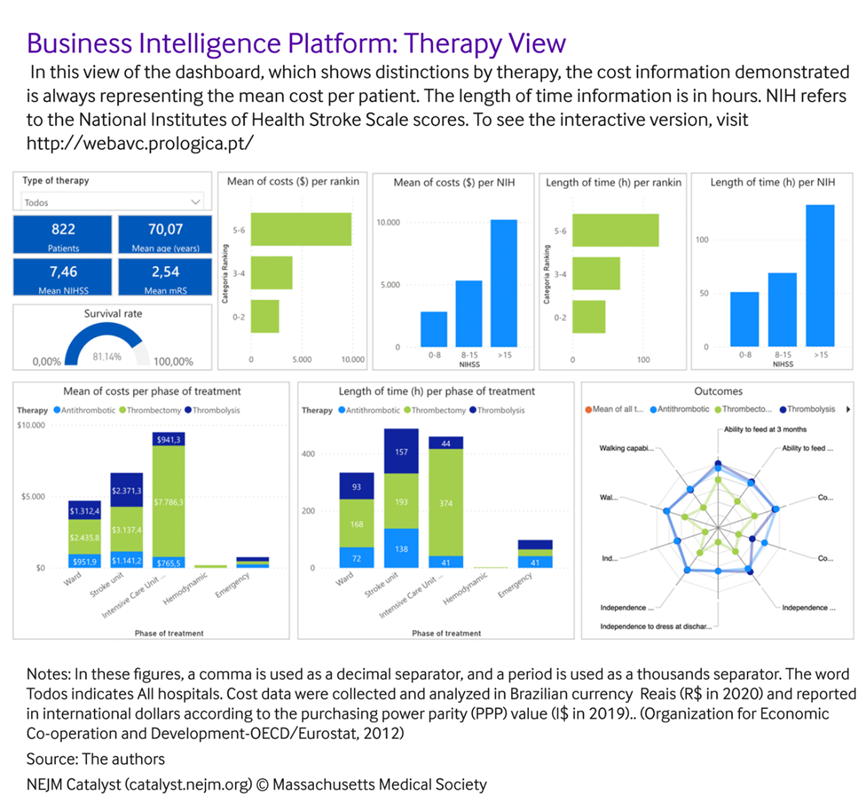
The other three views focused on outcomes, evaluating them by risk level (Figure 2), hospital (Figure 3), and main antithrombotic therapy performed (Figure 4).
Figure 1
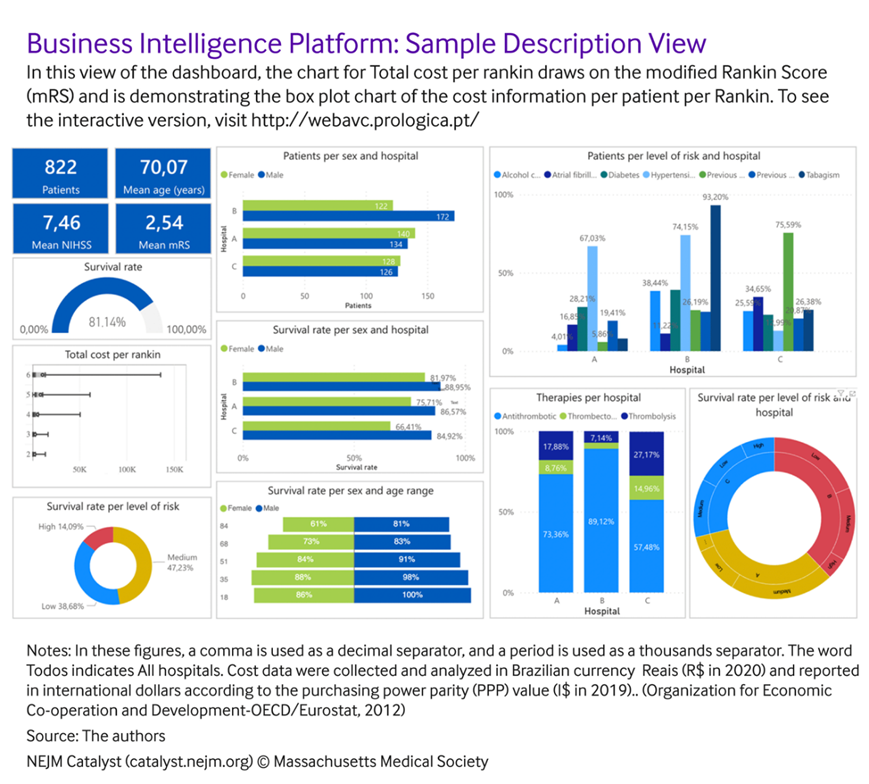
Figure 2
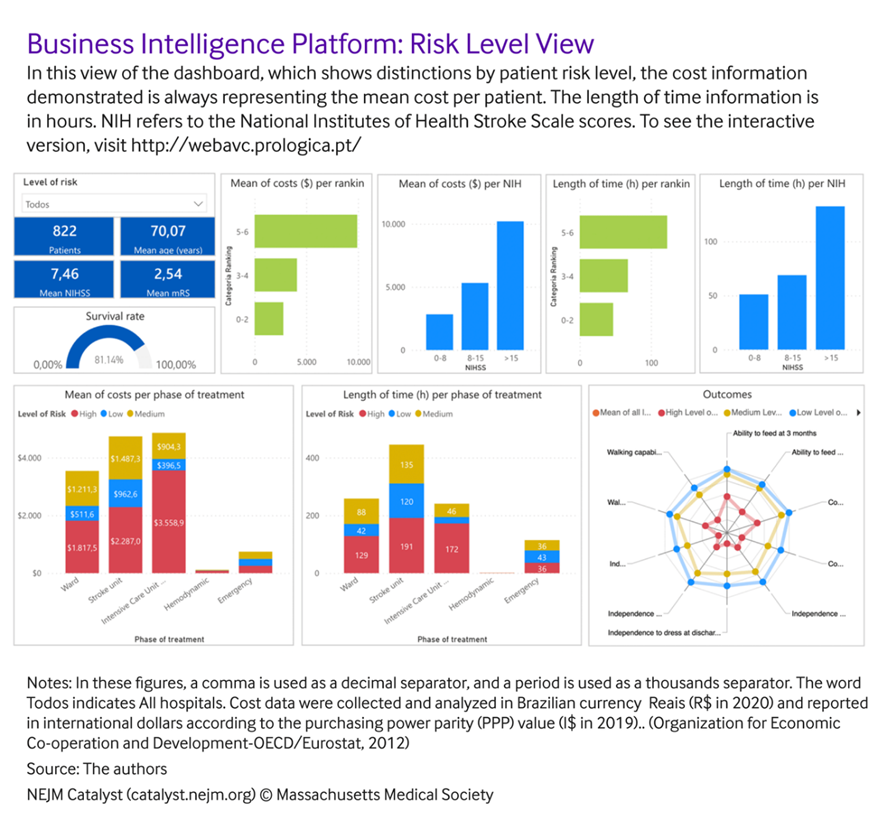
Figure 3
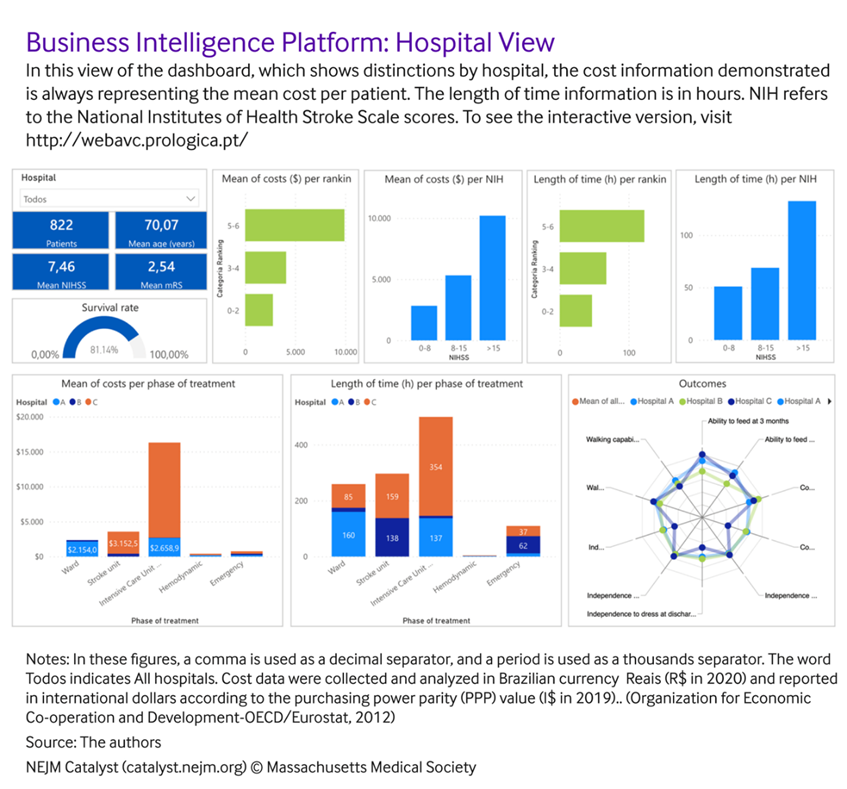
Figure 4
This BI platform has a variety of different views that are dynamic and interact with each other, which offers an easier and more engaging way to interpret the outcome results.
The process of designing and developing the platform followed the agile innovation method[27] to achieve all the requirements asked for by the main customers of the solution — namely clinicians, health care executives, and administrators.
The process of development included a sequence of meetings between the clinicians and the development team to achieve the best way to exhibit the information.
Results from BI Platform Implementation
Data from 822 patients were included in the data set used to develop the BI dashboard.
A digital solution with the capability to collect the PROMs data and TDABC cost estimates in real time from hospital systems or internal spreadsheets was designed and developed for the ischemic stroke care pathway.
In the sample description view (Figure 1), the mean results of the variables used to classify the risk levels (patient age and NIHSS score) and the mRS score are presented as the main measures. Survival rates are presented by hospital, risk level, and mRS.
Sex of the patient was also used as a stratification variable in all the groups.
The main comorbidities per hospital and the sample fragmentation per risk level were also demonstrated in this analytical view.
The digital tool is available online and it is possible for users to engage with the tool to explore how the information displays can be modified by selecting different groups of variables.
“This integrated approach to analyze costs and outcomes has inspired the development of standards of care that are being defined in 2022 for a national certification program for the stroke care pathway in Brazil.”
The clinical outcomes, PROMs, and cost estimates available in the risk level and hospital views (Figures 2 and 3, respectively) were developed to facilitate the understanding of how differences in costs, mRS, and length of time across risk levels attributed to patients, therapies used, and hospitals.
A group of measures and analytics charts were defined by the multidisciplinary team as standards for each view.
The mean NHISS score, mean age, and mean mRS are available in any of the dashboard views.
As standard charts, the mean cost per Rankin score and NHISS score and the mean length of stay in the hospital in hours per Rankin and NHISS were used.
Specific to each dashboard view, charts with the mean cost and length of time per treatment phase and the mean results observed for the ICHOM measures are also presented.
For these charts, in the dashboard view that compares the results observed for each risk level, the comparisons consider the results for the low-, medium-, and high-risk groups of patients.
The dashboard view that compares hospitals explores the results observed in each center.
In addition, in the results-per-therapy view users can compare the results achieved for patients treated with antithrombotic therapy, thrombolysis, or thrombectomy therapies.
By exploring the charts and the usability of the solution for the ultimate stakeholders, the development team made the process of discerning and demonstrating how the clinical and cost outcomes vary between the groups much easier and more intuitive.
For example, the platform allows users to analyze, in an integrated way, the differences in costs and outcomes for patients with different clinical conditions or treated with different therapies, which is not possible in traditional management systems used by financial and clinical managers.
Because of this integrated work, the digital solution created is used by the private hospital (Hospital A) to inform clinicians and administrators of the outcomes that have been achieved with different stroke care therapies as well as the associated cost estimates between the various treatment and risk profiles. This was previously not being done.
In addition, this integrated approach to analyze costs and outcomes has inspired the development of standards of care that are being defined in 2022 for a national certification program for the stroke care pathway in Brazil.
Similar projects, inspired by our work, are being designed in other stroke centers in Latin America, including Argentina, Mexico, Colombia, Costa Rica, and Brazil.
Regarding the national certification in Brazil, the BI solution is being used by hospital A to demonstrate how innovative technology can enable evidence-based health management using real-world data.
Implications of Business Intelligence Development for VBHC
Advances in business intelligence solutions that allow automation of the management processes for PROMs, clinical outcomes, and cost estimates could have an immense impact on the scalability of VBHC implementation.
This article demonstrates how an innovative analytics platform can integrate PROMs and cost information for a specific care pathway and be updated in real time once it is combined with a hospital’s electronic health records systems.
The level of detail on cost information provided by micro-costing methods, such as TDABC, can contribute to driving health care management toward value[28] [29]
Once these methods are applied in different institutions for the same clinical condition, it contributes to identifying benchmarks of care, achieving better outcomes at lower costs, and driving opportunities for cost savings.
An example of this process applied to interventional coronary procedures at five hospitals in Brazil is demonstrating cost variations that lead to improved care processes at lower costs.[30]
The capacity to employ information technology solutions to support data collection and analytics that can accelerate TDABC use in multiple centers simultaneously has been lacking.
The innovative solution developed in this study expands the capacity to automate TDABC analyses.
By applying a digital solution such as this one in several centers for the same clinical condition, it is possible to identify benchmarks of care and focus on interventions that can increase the efficacy and efficiency of care delivery.
“The innovative solution developed in this study expands the capacity to automate TDABC analyses. By applying a digital solution such as this one in several centers for the same clinical condition, it is possible to identify benchmarks of care and focus on interventions that can increase the efficacy and efficiency of care delivery.”
Designing digital platforms that can generate accurate and real-time cost and PROM data also represents an important step for the establishment of value-based reimbursement strategies.
Removing the obstacles to transparency in the exchange of information between providers and payers is a requirement to move toward value payments.[31]
When solutions are developed that can facilitate financial information transparency with shared interest between stakeholders, the challenge of tackling this obstacle can be reduced.
However, it is important that the information provided on the platform is easily understood by clinicians, health care executives, and financial managers.
At this point, interdisciplinary teamwork during the process of developing a solution could turn out to be a factor for eventual success.
The development of this solution shows that achieving an engaging user experience with an effective graphics and visual interface can be gained through collaborative design thinking.
For context, providing the capacity for stakeholders to have different data views, as outlined here, makes it possible to:
· Identify hospitals with similar patient profiles and lower costs or lengths of stay and, consequently, guide best practices of care for hospitals with higher costs or lengths of stays
- Manage variability in resource consumption and PROM results among patients with similar clinical conditions (risk levels) and those treated with the same therapy
- Identify clinical practice variability between hospitals and define benchmarks of care respecting the patients’ clinical conditions and technologies that are being used for treatment
- Provide a visual interface to be used by clinicians and hospital managers to decide together the best strategies to improve care delivery
- Provide accurate and real-time cost and PROM information using real-world data that can promote the establishment of value-based reimbursement strategies between payers and providers
- Facilitate, standardize, and accelerate the process of implementing a value-based health care program in ischemic stroke centers
Looking Ahead
There are important considerations for applying this analytics framework.
Although this business intelligence platform was created and tested for one specific clinical condition (ischemic stroke), we believe that, with thoughtful implementation, the learnings from this initiative can be extended to other medical conditions.
By combining the aforementioned methodology for multiple clinical conditions, it is also possible to generate a digital solution that illustrates data through several dashboards, each for a specific clinical condition, which hospitals can gradually implement.
Likewise, to make the platform “plug and play” for any other stroke centers to implement this analytical solution, modifications would need to be developed and implemented based on the organization’s strategy on collection and analysis of PROMs and cost estimates.
Learning from our experience of developing this analytics solution, other health care organizations can understand the design mechanisms and strategic considerations involved in creating a decision-support dashboard that can be updated in real time and enable leaders to make strategic management decisions that are based in evidence.
References & additional information
See the original publication
About the authors & affiliations
Ana Paula Beck da Silva Etges, PhD, Eng
Senior Researcher, Instituto de Avaliação de Tecnologia em Saúde, Porto Alegre, Brazil; Professor, Pontifícia Universidade Católica do Rio Grande do Sul, Porto Alegre, Brazil; Professor, Federal University of Rio Grande do Sul, Epidemiology, Porto Alegre, RS, Brazil
Junaid Nabi, MD, MPH
Senior Researcher, Health Care Strategy, Harvard Business School, Boston, Massachusetts, USA
Anne Geubelle, MBA
Chief Executive Officer, Prologica, Lisbon, Portugal; Co-founder, Way2Value
Sheila Ouriques Martins, MD, PhD
Chief of Neurology, Hospital Moinhos de Vento, Porto Alegre, Rio Grande do Sul, Brazil; Professor, Federal University of Rio Grande do Sul, Porto Alegre, RS, Brazil; President, World Stroke Organization, Geneva, Switzerland
Carisi Anne Polanczyk, MD, ScD
Chief of Cardiology, Hospital Moinhos de Vento, Cardiology, Porto Alegre, RS, Brazil; Professor, Federal University of Rio Grande do Sul, Cardiology Service, Porto Alegre, RS, Brazil; Senior Researcher and Coordinator, Instituto de Avaliação de Tecnologia em Saúde, Porto Alegre, Brazil
Originally published at https://catalyst.nejm.org
RELATED PAPERS