


This is a republication of the article “What to expect in US healthcare in 2023 and beyond”, with the title above.
inhealth
institute for continous health transformation
Joaquim Cardoso MSc
Founder, CEO and Senior Advisor
January 23, 2023
EXECUTIVE SUMMARY
The US healthcare industry faces difficult conditions in 2023 due to high inflation rates and labor shortages.
However, improvement efforts are expected to help the industry overcome these challenges in 2024 and beyond.
- Segments such as Medicare Advantage within payers, ambulatory surgery centers within providers, software and platforms within healthcare services and technology, and specialty pharmacy within pharmacy services can expect higher growth.
- However, the outlook for some segments has worsened compared with previous analysis, including general acute care and post-acute care within providers and Medicaid within payers.
- Factors that will likely influence shifts in profit pools include a shift in payer mix, with a substantial shift towards Medicare, and the ongoing COVID-19 pandemic which could result in healthcare costs of about $200 billion annually in the United States.
IN SHORT
- The US healthcare industry faces demanding conditions in 2023, including recessionary pressure, continuing high inflation rates, labor shortages, and endemic COVID-19.
- But players are not standing still.
- We expect accelerated improvement efforts to help the industry address these challenges in 2024 and beyond, leading to an eventual return to historical average profit margins.
INFOGRAPHIC
Exhibit 1 Profit pools for commercial and Medicare Advantage segments, physician offices, healthcare services and technology, and specialty pharmacy segments are predicted to grow the fastest post-COVID-19.
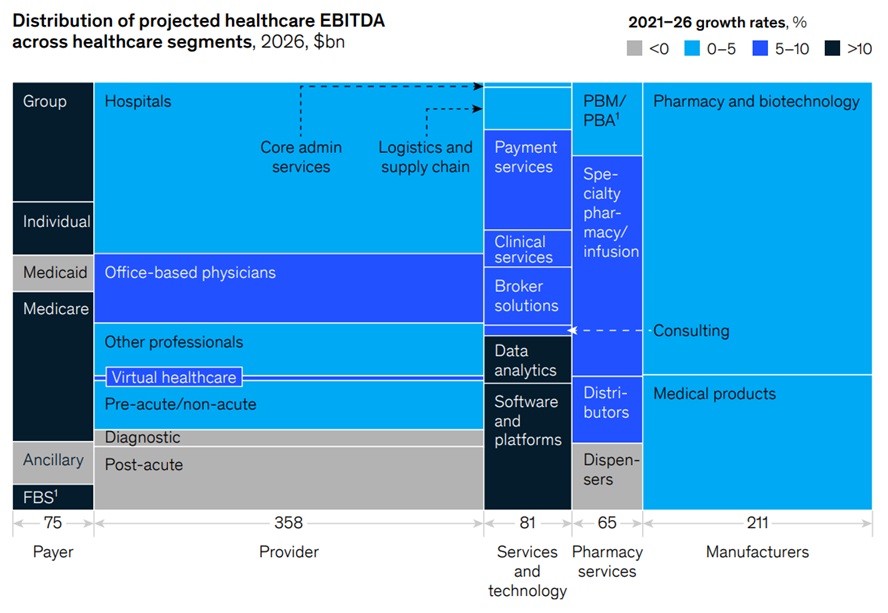
Exhibit 4 Providers may face three potential scenarios for EBITDA recovery.
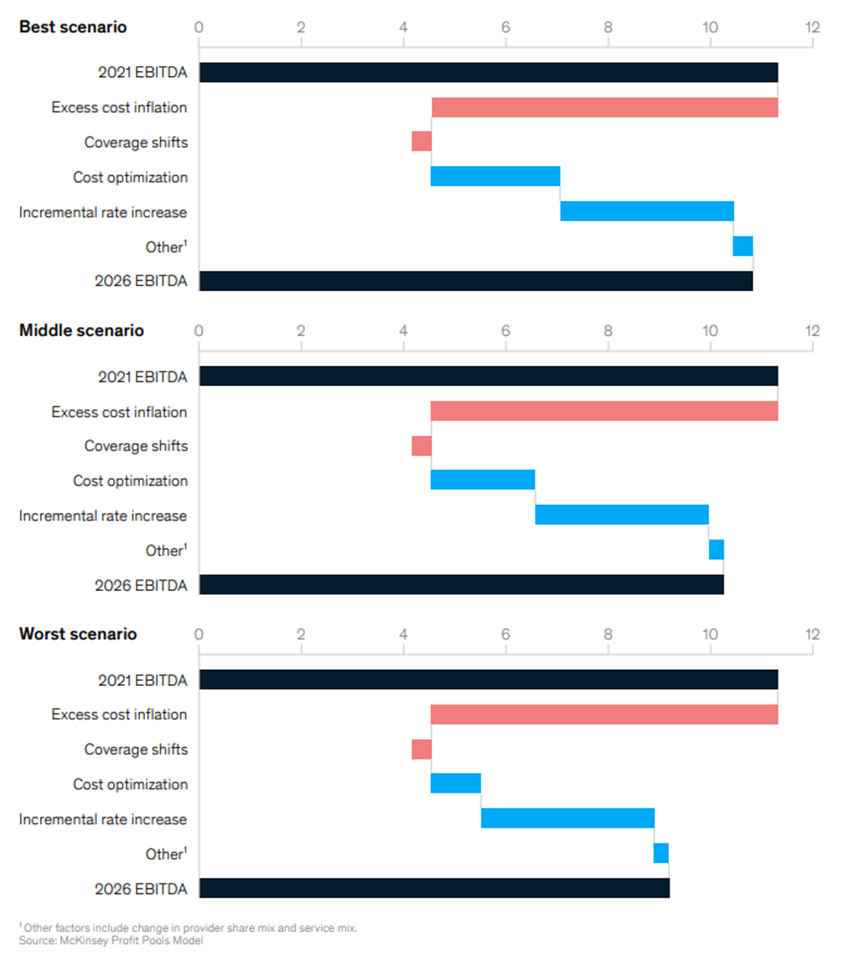
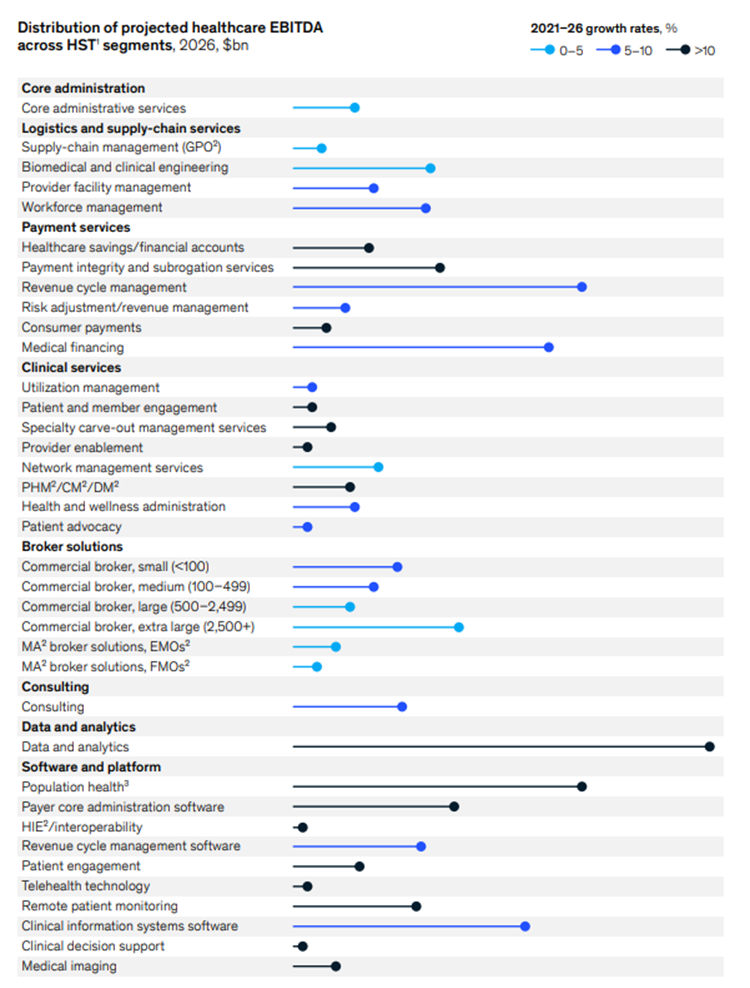
Exhibit 5, part 1 Healthcare services and technology profit pools are projected to continue positive growth from 2021 to 2026, particularly in data and technology-focused segments.
DEEP DIVE

What to expect in US healthcare in 2023 and beyond
Recent developments have complicated the outlook for industry profit pools.
By Neha Patel and Shubham Singhal
January, 2023
When we last looked at the trajectory of the US healthcare industry …
… in our July 2022 article, “The future of US healthcare: What’s next for the industry post-COVID-19?,”
… we had emerging concerns about what persistent inflation could cause.[1]
It is now clear that inflation is not transitory and that the economic outlook has meaningfully darkened.[2] These economic troubles, combined with a healthcare-worker shortage and endemic COVID-19, are clouding the industry outlook. Below, we update how these changes could affect payers, providers, healthcare services and technology (HST), and pharmacy services.
Based on updated and expanded projections, we estimate that healthcare profit pools will grow at a 4 percent CAGR from $654 billion in 2021 to $790 billion in 2026; …
… in our previous article, we estimated a 6 percent growth from 2021 to 2025.
The industry faces difficult conditions in 2023, primarily because of continuing high inflation rates and labor shortages. However, we expect improvement efforts to help the industry overcome these challenges in 2024 and beyond. Several segments can expect higher growth: Medicare Advantage within payers; care settings such as ambulatory surgery centers within providers; software and platforms (for example, patient engagement and clinical decision support) within HST and specialty pharmacy within pharmacy services. These assessments generally align with our earlier article’s conclusions. On the other hand, the outlook for some segments has worsened compared with our previous analysis, including general acute care and post-acute care within providers and Medicaid within payers.
Going forward, a number of factors will likely influence shifts in profit pools. These include:
- 1.Change in payer mix
- 2.Endemic COVID-19:
1.Change in payer mix:
A substantial shift toward Medicare will continue, led by growth in the over-65 population of 3 percent per year projected over the next five years and continued popularity of Medicare Advantage among seniors, as reflected in the latest Centers for Medicare & Medicaid Services (CMS) enrollment data.[3]
However, based on our models, Medicaid enrollment could decline by about ten million lives over five years given recent legislation that will allow states to begin eligibility redeterminations, which were paused during the federal public health emergency that was declared at the start of the COVID-19 pandemic.[4]
Commercial segment margins in 2021 were about 200 basis points lower than 2019 levels, resulting from the return of deferred care.
We expect profit pools in this segment to rebound and grow at a 15 percent CAGR as EBITDA margins will likely return to historical averages by 2026.
The growth will be partially offset by enrollment changes in the segment, prompted by a shift from fully-insured to self-insured businesses that could accelerate as employers facing recessionary pressure seek to cut costs.
2.Endemic COVID-19:
Since the publication of our last article, COVID-19 has moved more and more toward an endemic stage.
Based on our estimates, endemic COVID-19 could result in healthcare costs of about $200 billion annually in the United States.
The majority of these costs would be related to the prevention and treatment of COVID-19 cases as well as long COVID.[5]
The industry faces difficult conditions in 2023
Exhibit 1 Profit pools for commercial and Medicare Advantage segments, physician offices, healthcare services and technology, and specialty pharmacy segments are predicted to grow the fastest post-COVID-19.
In July 2022, we estimated 2021 payer profit pools to be $40 billion, however, actual 2021 profit pools were $5 billion higher.
Higher Medicaid EBITDA margins due to the extended public health emergency accounted for the majority of the increase, although it was partially offset by lower-than-expected commercial margins with the return of deferred care. Also, we previously forecasted a 9 percent CAGR in 2021 to 2025 payer profit pools. In our updated and expanded estimates, this profit pool is expected to grow faster at an 11 percent CAGR from 2021 through an additional year to 2026, reaching $75 billion in the latter year. This is underpinned by inflation-driven incremental premium rate increases and accelerated Medicare Advantage penetration. Nonetheless, we expect that growth will be slower than normal between 2022 and 2023 due to inflationary pressure and provider reimbursement rate increases, both in-year margin pressures (Exhibit 2).
Exhibit 2 By 2026, estimated profit pools for government segments will be about 50 percent larger than commercial segments driven by accelerated Medicare Advantage penetration.
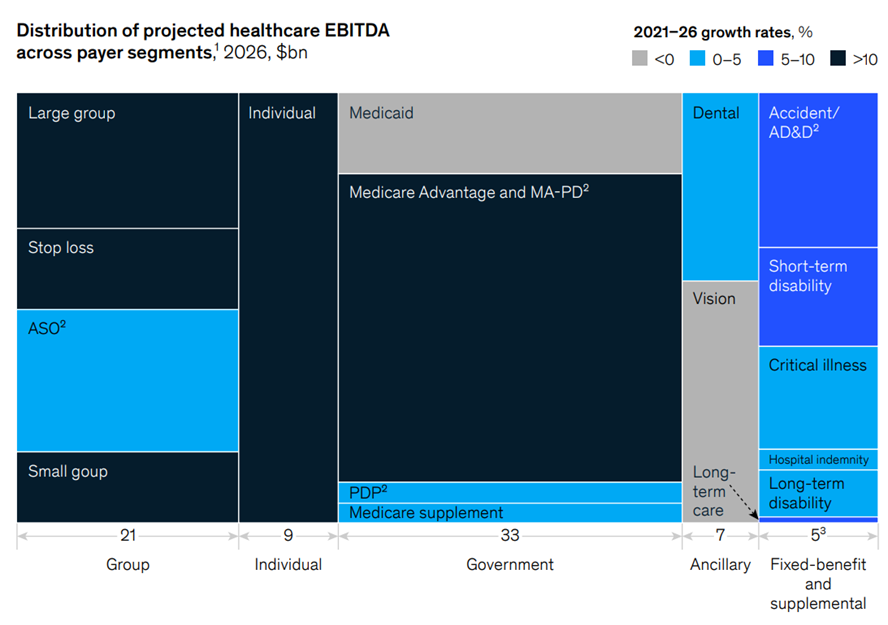
Based on our revised estimates, the mix of payer profit pools will shift further toward the government segment.
Overall, the estimated profit pools for this segment are expected to be about 50 percent greater than the commercial segment by 2026 ($33 billion compared with $21 billion) as Medicare Advantage penetration is expected to reach 52 percent in 2026. Profit pools for the commercial segment declined from $18 billion in 2019 to $11 billion in 2021 as margins compressed with the return of deferred care. We expect the commercial segment’s EBITDA margins to return to historical levels by 2026, and profit pools to reach $21 billion, growing at a 15 percent CAGR from 2021 to 2026. Within this segment, a shift from fully-insured to self-insured business will likely accelerate as recessionary pressures prompt employers to cut costs. The fully-insured group enrollment could drop by 150 basis points annually from 2021 to 2026, and self-insured increase by 100 basis points annually during the same period.
We expect increased labor costs and administrative expenses to reduce payer EBITDA by about 60 basis points in 2022 and 2023 combined.
In addition, providers will push for reimbursement rate increases (up to about 350 to 400 basis-point incremental rate increases from 2023 to 2026 for the commercial segment and about 200 to 250 basis points for the government segment), according to McKinsey analysis and interviews with external experts.[6]
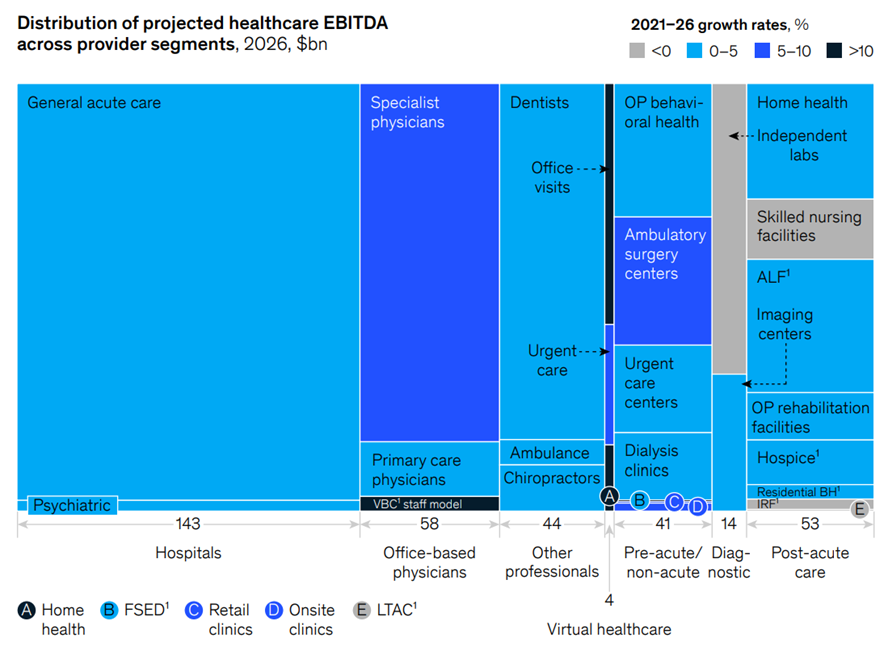
Exhibit 3 Most provider segments will grow less than 5 percent CAGR from 2021 to 2026 due to cost increases.
In July 2022, we estimated that provider profit pools would grow at a 7 percent CAGR from 2021 to 2025.
We now forecast a 3 percent CAGR from 2021 to 2026 in our updated and expanded estimates, with the decline primarily due to increased costs owing to high inflation and labor shortages.
Provider profit pools grew from $273 billion in 2019 to $314 billion in 2021, a 7 percent CAGR.
Growth in 2021 resulted from making up for care deferred from the first year of the COVID-19 pandemic as well as additional healthcare demand attributable to COVID-19. Provider profit pools faced substantial pressure in 2022 and are likely to continue to do so in 2023 as a result of inflation and increased labor costs. We now estimate that total EBITDA will fall by 25 percent from 2021 to 2023, declining to $235 billion. We then forecast a rebound, with 15 percent annual growth from 2023 to 2026, or total EBITDA of $358 billion by 2026 (estimates now include 2026 as an additional projected year).
We anticipate that providers will seek reimbursement increases of about 350 basis points from 2023 to 2026 (above set rate increases).
There are three potential scenarios that providers may face for EBITDA recovery.
Within this overall negative outlook for providers, there are meaningful exceptions.
Although post-acute care profit pools could be severely affected by labor shortages (particularly nurses), other sites of care (such as ambulatory surgery centers) and virtual care should continue to grow. We also anticipate an accelerated adoption of value-based care as stakeholders, including a broader set of providers and payers, aim for enhanced care management and effective cost management through improved utilization and other measures, such as increasing the use of alternative sites of care.[7]
Exhibit 4 Providers may face three potential scenarios for EBITDA recovery.
Exhibit 5, part 1 Healthcare services and technology profit pools are projected to continue positive growth from 2021 to 2026, particularly in data and technology-focused segments.
We expect to see continued cost optimization measures to tackle rising costs, such as increased labor productivity efforts and the application of technological innovation.
In a positive best-case scenario, where the majority of hospitals and a third of post-acute players recoup substantial cost savings (350 basis points for hospitals, 250 for post-acute), industry EBITDA margins would decline by 90 basis points. In a downside worst-case scenario, where lower savings are achieved (200 basis points for hospitals, 150 basis points for post-acute) for half of hospitals and a quarter of acute care players, we estimate margin deterioration of 250 basis points from a baseline of 12 percent.
We expect to see continued cost optimization measures to tackle rising costs, such as increased labor productivity efforts and the application of technological innovation.
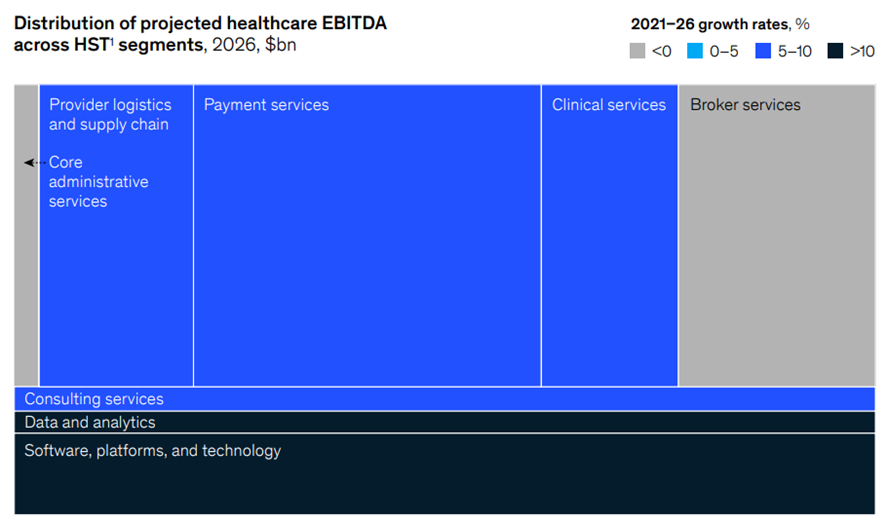
In July 2022, we estimated that 2022 HST profit pools would be $53.7 billion. We have revised our estimate to $49 billion because of wage inflation and the drag of fixed technology investment that has not achieved its full benefits yet.1
However, we see solid growth in the sector starting in 2023, especially as technology adoption by providers and payers continues to accelerate. We now estimate a 10 percent CAGR between 2021 and 2026, to $81 billion by 2026. This is a one percentage-point-higher CAGR than our July estimates last year for 2021 to 2025 growth, due to greater demand from payers and providers looking to improve efficiency. That would make it the fastest-growing sector in healthcare. We see the greatest acceleration in software and platforms (for example, patient engagement and clinical decision support) as well as data and analytics, with 13 percent and 19 percent CAGRs, respectively.
Three factors account for the anticipated faster growth in HST.
First, we expect higher demand from payers and providers to improve efficiency and address labor challenges.
Second, payers and providers are likely to be willing to absorb vendor price increases where there is clear value.
Third, we expect HST companies to make operational changes that will improve efficiency, including through the use of technology and automation across services.
Exhibit 5, part 2 Healthcare services and technology profit pools are projected to continue positive growth from 2021 to 2026, particularly in data and technology-focused segments.
Exhibit 6 Pharmacy services will continue to see benefits from the growth of specialty pharmacy.
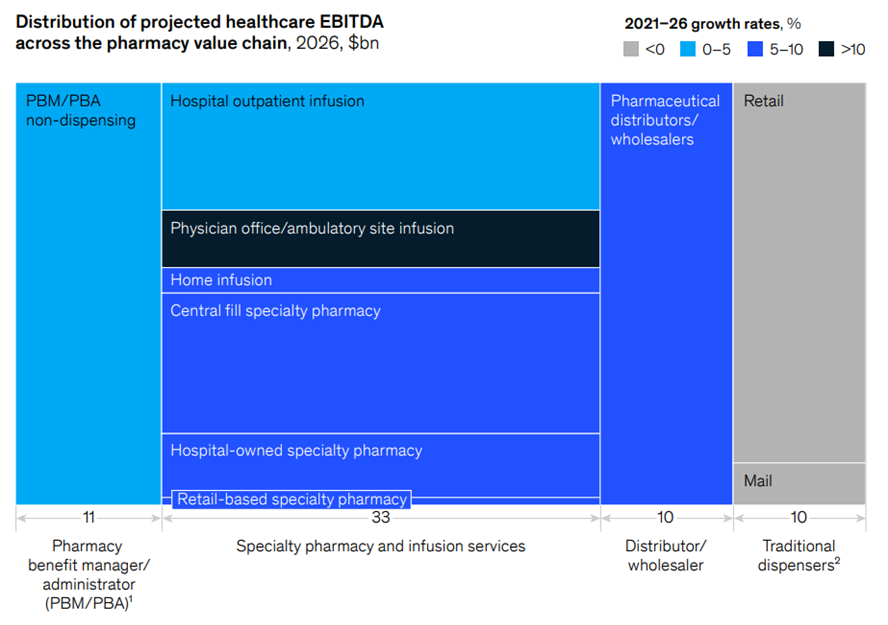
In July 2022, we estimated that pharmacy services profit pools would grow at a 3 percent CAGR from 2021 to 2025. Our updated estimates found that this growth rate will remain the same from 2021 through an additional year of 2026, with profit pools reaching $65 billion by 2026 from $55 billion in 2021. The growth is largely due to continued utilization of drugs and higher prices for specialty drugs but will be partially offset by reimbursement pressure, reduced profit margins, and the growth of specialty generics and biosimilars.
We expect accelerated improvement efforts to help the industry address these challenges in 2024 and beyond.
Specialty pharmacy profit pools are expected to increase at a 7 percent CAGR from 2021 to 2026, a lower rate than our previous 2021 to 2025 estimate; contract pharmacy pressures in particular have affected margins across this segment.
Physician office and ambulatory infusions have outpaced initial growth estimates, with the overall market expected to grow at an 11 percent CAGR from 2021 to 2026 compared to the overall infusion-market growth rate of 9 percent for the same period.
Retail dispenser profit pools are expected to fall due to reimbursement pressures and margin contraction; this is in addition to challenges they face from reductions in COVID-19 vaccine administration and testing (retail pharmacies administered about 200 million vaccines in 2021 compared to about 85 million in 2022).[8]
In addition, the pharmacy services sector continued to face worker shortages and inflationary pressures throughout 2022. These challenges affected dispensers across channels — for example, traditional retail dispensers, and retail-based specialty and provider-based pharmacies. Many of them offered higher wages and benefits, while others limited pharmacy operating hours, closed, or optimized their store footprint.[9] Some larger players are investing in additional technology enablement, like micro-fulfillment centers and robotics, to expand capacity and lower dispensing costs over the next few years.[10] In the future, investment in technology and automation will continue to reshape the pharmacy industry as well as increase the role of pharmacists in delivering services and clinical guidance to patients.
The US healthcare industry faces demanding conditions in 2023, including recessionary pressure, continuing high inflation rates, labor shortages, and endemic COVID-19.
But players are not standing still.
We expect accelerated improvement efforts to help the industry address these challenges in 2024 and beyond, leading to an eventual return to historical average profit margins.
References and additional information
See the original publication