


The Kings Fund
Jonathon Holmes, and Danielle Jefferies
27 September 2021
Key messages:
- Long waiting times and growing waiting lists for hospital treatment have been a problem for some time, but now the Covid-19 pandemic has exacerbated the issue and waiting lists have grown rapidly.
- As with other aspects of the pandemic, this has not been experienced equally.
- Our analysis of waiting list data shows a clear relationship with deprivation, which sees those living in the most deprived areas nearly twice as likely to wait more than a year for treatment compared to those living in the least deprived areas.
Variation
The most recent data shows that 5.6 million people are currently waiting for NHS treatment, with some estimates suggesting that this backlog could reach up to 13 million in the coming months as more people come forward and are referred for treatment.
These are deeply concerning numbers: at best waiting for treatment is frustrating and uncomfortable, and at worst it sees people’s health deteriorate and outcomes worsen. Long waiting times can also impact people’s financial and economic security, with polling commissioned by Healthwatch England finding that 42 per cent of adults who had experienced a delay in their treatment said it impacted their ability to work.
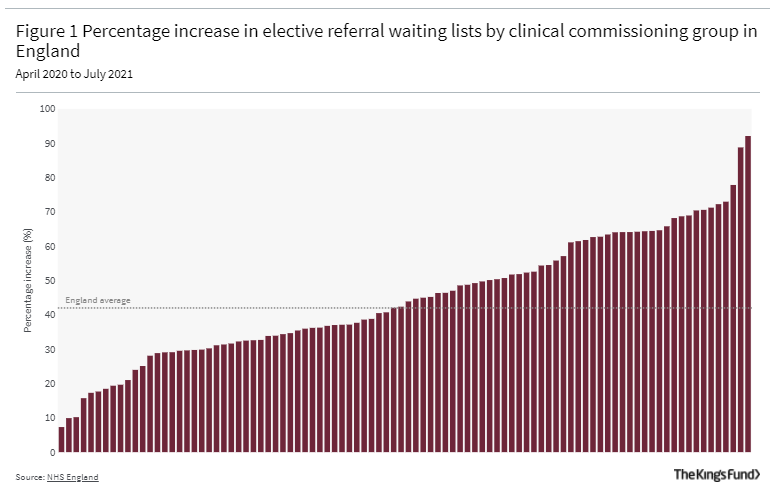
We also know that the backlog has not grown equally or consistently across the country. Figure 1 shows the level of variation between clinical commissioning groups (CCGs) in England. Nationally the elective waiting list increased by 42 per cent between April 2020 and July 2021. In some areas it grew by less than 10 per cent, in others it grew by around 90 per cent.
The relationship with deprivation
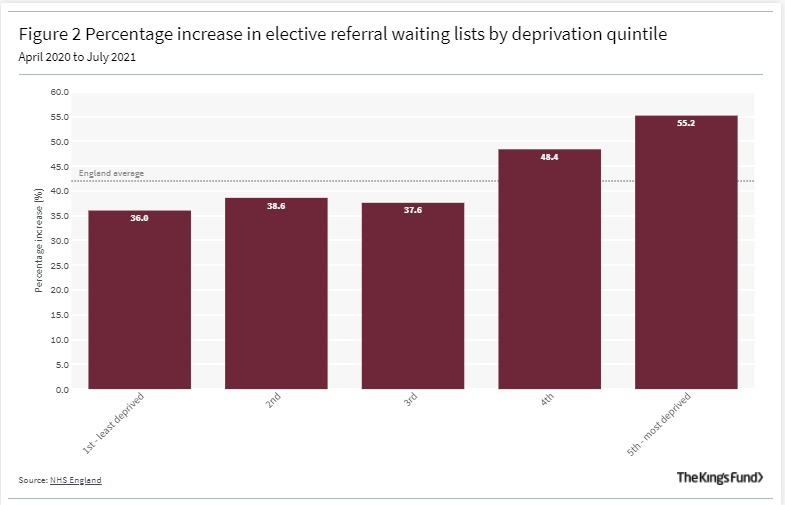
Figure 2 shows the relationship between rate of growth of waiting lists and relative deprivation.
On average waiting lists have increased by more than half (55.2 per cent) in the most deprived areas, compared to a third (36 per cent) in the least deprived areas, the national average was 42 per cent.
On average waiting lists have increased by more than half (55.2 per cent) in the most deprived areas, compared to a third (36 per cent) in the least deprived areas, the national average was 42 per cent.
After the scale of disruption to services caused by Covid-19, it is important to remember that a growing waiting list is not necessarily a bad thing. It shows that referral routes are working, and that people are willing to come forward for treatment where previously they had not.
However, when we look at length of wait, specifically at those who have had to wait more than one year for treatment we find a more concerning trend.
- The number waiting more than one year for treatment has increased rapidly across the country, but more so in the most deprived areas.
- Our analysis shows that 4.02 per cent of people currently waiting for treatment in the least deprived areas have been waiting for more than one year, compared to 7.29 per cent in the most deprived.
- This means that on average you are 1.8 times more likely to experience a wait of more than one year if you live in one of the most deprived areas.
… on average you are 1.8 times more likely to experience a wait of more than one year if you live in one of the most deprived areas.
Understanding the causes and potential solutions
A range of long-standing social, economic and environmental factors saw the most deprived parts of the country experience significantly higher Covid-19 infection and mortality rates throughout the pandemic.
As such, health systems in these areas were likely to face greater and more persistent disruption to services.
At the same time the long-observed ‘ inverse care law’ meant these same areas were often starting from a lower baseline of capacity and typically had populations with greater health care needs.
Recent analysis on inequalities in access to care conducted by the Strategy Unit made similar conclusions, but also noted that access to NHS-funded private sector treatment is also substantially higher in less deprived areas.
… access to NHS-funded private sector treatment is also substantially higher in less deprived areas.
However, our analysis also highlights some areas within the most deprived quintile that have seen their waiting lists grow as more people have been referred for treatment, but which have been able to contain the number waiting more than a year for treatment.
Anecdotally, we know that there is transferable learning from these areas.
- For example, one area we have spoken to stressed relational points around collaboration between providers and between CCGs, including sharing resource and capacity.
- Another aspect they emphasised was prioritisation, not just of specialities like trauma and orthopaedics where demand has grown most rapidly,
- but also of population groups where greatest levels of need, or indeed unmet need, are likely to be.
Tackling the issue is a priority for the government who have put significant resource and political will behind it.
- At a national level NHS England’s operational planning guidance for 2021/22 identifies tackling the waiting list in an inclusive way as a priority.
- It will not be lost on ministers that reducing waiting times is now also the public’s top priority for the NHS and that many of the areas where waiting lists are rising most rapidly, and where people are waiting longer for hospital treatment, are in the so called ‘red-wall’ constituencies.
With the prospect of a challenging winter and waiting lists growing further, a continued focus on tackling the backlog in an inclusive way will be vital.
Different areas will be facing their own specific challenges.
While support from central government will be important, so too is giving local health systems the flexibility to work through the backlog in a way that is tailored to meet the needs and tackle the inequalities experienced in the populations they serve.
A range of long-standing social, economic and environmental factors saw the most deprived parts of the country experience significantly higher Covid-19 infection and mortality rates throughout the pandemic.
About the Methodology:
The data analysed is drawn from NHS England’s consultant-led referral to treatment waiting times data for 2021/22 and the Ministry of Housing Communities and Local Government’s English indices of multiple deprivation 2019. The measure of deprivation takes account of income, employment, education, skills and training, among other factors.
There are currently 106 CCGs in England, and a sample of 94 was used for the analysis. People in those 94 areas account for more than 4 million people waiting to receive NHS consultant-led treatment, equivalent to 72 per cent of the total waiting list (5.6 million in July 2021). Some CCGs were excluded from the analysis because their geographical footprint had changed over the reference period, or because they include trusts that did not report data in the period. Commissioning regions and hubs were also excluded as they do not have a single deprivation measure.
Analysis of the number of waits of more than 52 weeks in July 2021, shows that in the most deprived quintile 7.3 per cent of patients had been waiting more than 52 weeks compared to 4 per cent in the least deprived quintile (1.8 times higher).
Originally published at https://www.kingsfund.org.uk on September 27, 2021.