Executive Summary
What is the total cost of waste in health care (in the US)
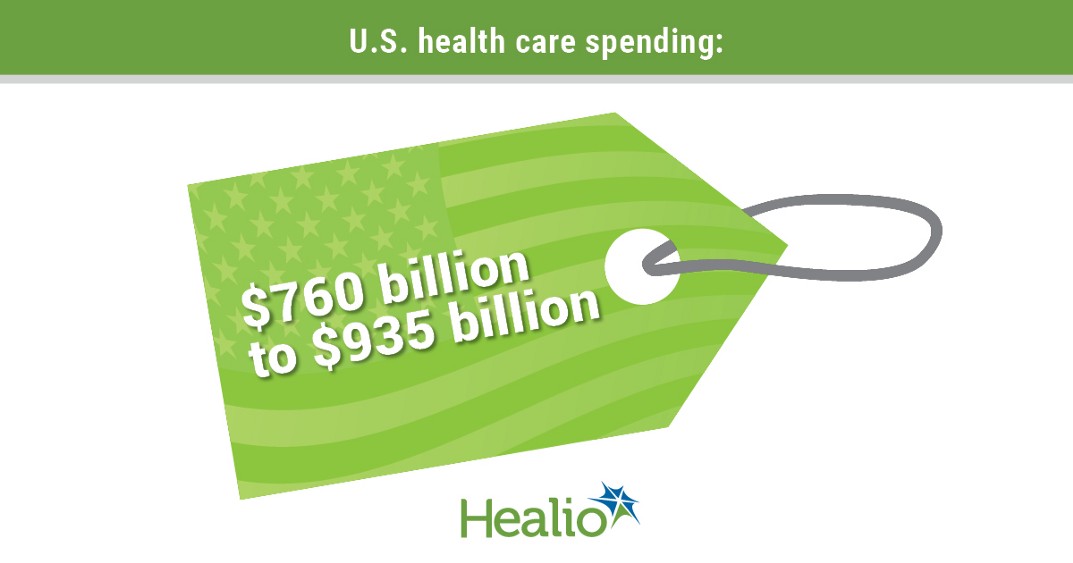
- Shrank et all (2019) estimated that the cost of waste in the US health care system ranged from $760 billion to $935 billion, accounting for approximately 25% of total health care spending, …
- … and the projected potential savings from interventions that reduce waste, excluding savings from administrative complexity, ranged from $191 billion to $286 billion, …
- … representing a potential 25% reduction in the total cost of waste.
- Implementation of effective measures to eliminate waste represents an opportunity reduce the continued increases in US health care expenditures.
See the appendix 1, for the Summary version of the paper.
What is the # 1 waste in health care in the US?
- According to their estimate Administrative Complexity is the # 1 Waste in health care in the US is Administrative Waste — $265.6 billion (out of $760 to $935 : 28% to 35%)
- Two articles addressed cost of waste from administrative complexity (Table 2), and no articles were identified that addressed savings from interventions.
- The estimated total annual cost of waste in this category was $265.6 billion.
See the appendix 1, for the Summary version of the paper.
What are the two main categories of Administrative Waste?
- The two main categories of Administrative Waste are: (1) Billing and Coding Waste, and (2) Physician time spent reporting on quality measures
- Billing and Coding Waste, account for $ 248 billion of waste
- Physician time spent reporting on quality measures, account for $ 17.6 billion of waste
See appendix 2, for the original publication used for the based of the estimates.
See appendix 3, for the excerpt of the original publication used for the based of the estimates.
APPENDIX 1:
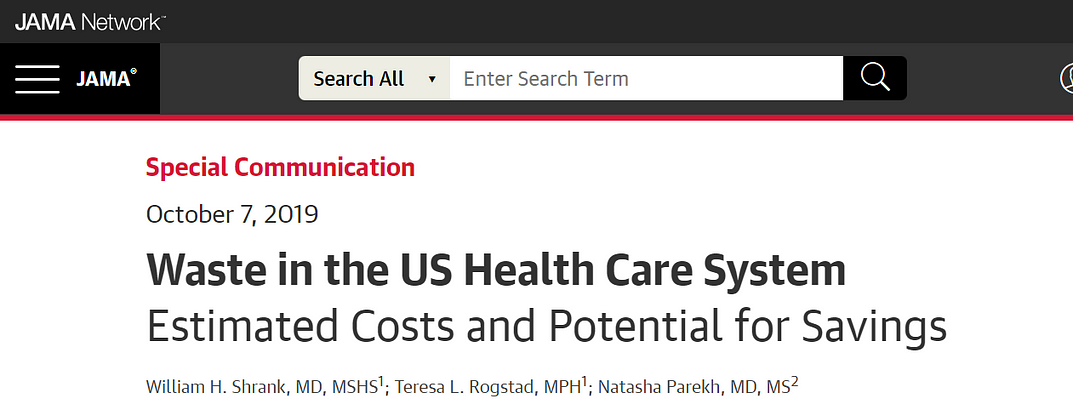
Waste in the US Health Care System — 25% of total health care spending
Estimated Costs and Potential for Savings
JAMA Network
William H. Shrank, MD, MSHS1; Teresa L. Rogstad, MPH1; Natasha Parekh, MD, MS2
October 7, 2019
IMPORTANCE
The United States spends more on health care than any other country, with costs approaching 18% of the gross domestic product (GDP).
Prior studies estimated that approximately 30% of health care spending may be considered waste.
Despite efforts to reduce overtreatment, improve care, and address overpayment, it is likely that substantial waste in US health care spending remains.
OBJECTIVES
To estimate current levels of waste in the US health care system in 6 previously developed domains and to report estimates of potential savings for each domain.
EVIDENCE
A search of peer-reviewed and “gray” literature from January 2012 to May 2019 focused on the 6 waste domains previously identified by the Institute of Medicine and Berwick and Hackbarth: failure of care delivery, failure of care coordination, overtreatment or low-value care, pricing failure, fraud and abuse, and administrative complexity.
For each domain, available estimates of waste-related costs and data from interventions shown to reduce waste-related costs were recorded, converted to annual estimates in 2019 dollars for national populations when necessary, and combined into ranges or summed as appropriate.
Findings
The review yielded 71 estimates from 54 unique peer-reviewed publications, government-based reports, and reports from the gray literature.
Table 2. Cost Estimates by Waste Domain
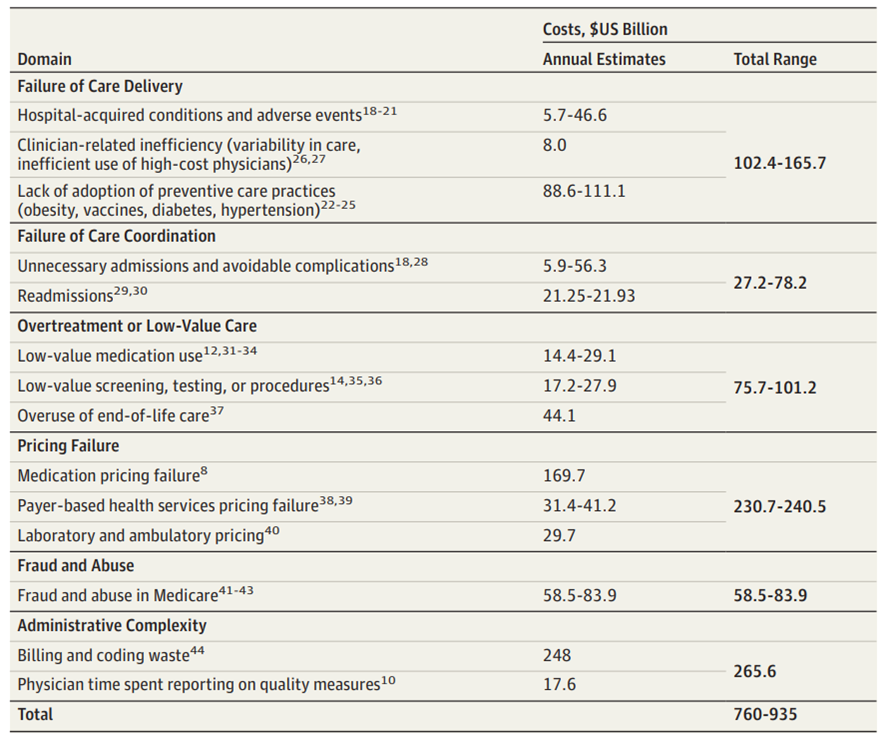
Computations yielded the following estimated ranges of total annual cost of waste:
· failure of care delivery, $102.4 billion to $165.7 billion;
· failure of care coordination, $27.2 billion to $78.2 billion;
· overtreatment or low-value care, $75.7 billion to $101.2 billion;
· pricing failure, $230.7 billion to $240.5 billion;
· fraud and abuse, $58.5 billion to $83.9 billion; and
· administrative complexity, $265.6 billion.
The estimated annual savings from measures to eliminate waste were as follows:
· failure of care delivery, $44.4 billion to $97.3 billion;
· failure of care coordination, $29.6 billion to $38.2 billion;
· overtreatment or low-value care, $12.8 billion to $28.6 billion;
· pricing failure, $81.4 billion to $91.2 billion; and
· fraud and abuse, $22.8 billion to $30.8 billion.
No studies were identified that focused on interventions targeting administrative complexity.
· The estimated total annual costs of waste were $760 billion to $935 billion
· and savings from interventions that address waste were $191 billion to $286 billion.
Conclusions and Relevance
In this review based on 6 previously identified domains of health care waste, the estimated cost of waste in the US health care system ranged from $760 billion to $935 billion, accounting for approximately 25% of total health care spending, …
… and the projected potential savings from interventions that reduce waste, excluding savings from administrative complexity, ranged from $191 billion to $286 billion, …
… representing a potential 25% reduction in the total cost of waste.
Implementation of effective measures to eliminate waste represents an opportunity reduce the continued increases in US health care expenditures.
APPENDIX 2 :
Excess Administrative Costs Burden the U.S. Health Care System
Reforms to cut waste in health care financing would save billions of dollars annually.
Center for American Progress (CAP)
By Emily Gee and Topher Spiro
April 8, 2019
Originally published at https://www.americanprogress.org

Anyone interacting with the U.S. health care system is bound to encounter examples of unnecessary administrative complexity — from filling out duplicative intake forms to transferring medical records between providers to sorting out insurance bills. This administrative complexity, with its associated high costs, is often cited as one reason the United States spends double the amount per capita on health care compared with other high-income countries even though utilization rates are similar.1
Each year, health care payers and providers in the United States spend about $496 billion on billing and insurance-related (BIR) costs, according to Center for American Progress estimates presented in this issue brief. As health care costs continue to rise, a logical starting point for potential savings is addressing waste. A 2010 report by the National Academy of Medicine (NAM) estimated that the United States spends about twice as much as necessary on BIR costs.2 That administrative excess currently amounts to $248 billion annually, according to CAP’s calculations.
This issue brief provides an overview of administrative expenditures in the U.S. health care system. It first explains the components of administrative costs and then presents estimates of the administrative costs borne by payers and providers. Finally, the issue brief describes how the United States can lower administrative costs through comprehensive reforms and incremental changes to its health care system. Many of the universal health care plans being discussed to expand coverage and lower costs would lower administrative costs through rate regulation, global budgeting, or simplifying the number of payers.3 Each of these financing changes deserves consideration — even in the absence of major systemwide reform.
Components of administrative costs
The main components of administrative costs in the U.S. health care system include BIR costs and hospital or physician practice administration.4 The first category, BIR costs, is part of the administrative overhead that is baked into consumers’ insurance premiums and providers’ reimbursements. It includes the overhead costs for the health insurance industry and providers’ costs for claims submission, claims reconciliation, and payment processing. The health care system also requires administration beyond BIR activities, including medical record-keeping; hospital management; initiatives that monitor and improve care quality; and programs to combat fraud and abuse.
To date, few studies have estimated the systemwide cost of health care administration extending beyond BIR activities. In a 2003 article in The New England Journal of Medicine, researchers Steffie Woolhandler, Terry Campbell, and David Himmelstein concluded that overall administrative costs in 1999 amounted to 31 percent of total health care expenditures or $294 billion5 — roughly $569 billion today when adjusted for medical care inflation.6
31% of total health care expenditures in 1999 were from administrative costs or $294 billion — roughly $569 billion today when adjusted for medical care inflation
A more recent paper by Woolhandler and Himmelstein, which looked at 2017 spending levels, placed the total cost of administration at $1.1 trillion.7
Billing and insurance-related costs
Many studies of administrative costs limit their scope to BIR costs. The BIR component of administration is most relevant to systemwide reforms that seek to reduce the expenses related to claims processing, billing rates, or health insurance. The largest share of BIR costs is attributable to insurance companies’ profits and overhead and to providers8 where BIR costs include tasks such as record-keeping for claims submission and billing.
The costs associated with BIR administration can extend beyond the chief parties involved in receiving and submitting claims. The process of claims denials has become an industry unto itself, with private firms squeezing dollars out of Medicaid programs.9 One study estimated that the aggregate value of challenged claims ranges from $11 billion to $54 billion annually.10 Claims can also be manipulated to boost providers’ or insurers’ profits by recording services rendered in maximum detail and exaggerating the severity of patients’ conditions — a practice known as upcoding.11 Upcoding costs Medicare Advantage billions of dollars in excess expenditures,12 and in many cases the practice constitutes fraud.13
The NAM published one of the most thorough reports on U.S. administrative costs related to billing and insurance in 2010. In a synthesis of the literature on administrative costs, the NAM report concluded that BIR costs totaled $361 billion in 2009 — about $466 billion in current dollars — among private insurers, public programs, and providers, amounting to 14.4 percent of U.S. health care spending at the time.
The NAM estimated that BIR costs account for
- 13 percent of physician care spending;
- 8.5 percent of hospital care spending;
- 10 percent of spending on other providers;
- 12.3 percent of spending on private insurance; and
- 3.5 percent of public program spending, including Medicare and Medicaid.14
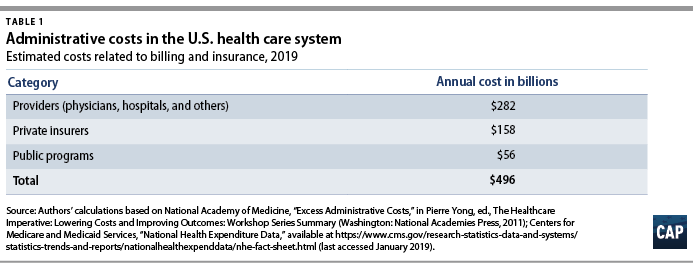
Applying the NAM’s percentages of BIR costs to recent projections of national health expenditures from the Centers for Medicare and Medicaid Services (CMS), CAP estimates that BIR costs will amount to $496 billion for 2019.15 (see Table 1)
According to CAP’s calculations, this includes
- $158 billion in overhead for private insurance;
- $56 billion for administration of public insurance programs; and
- $282 billion for the BIR costs of hospitals, physicians, and other care providers.
CAP’s estimate does not include the administrative costs associated with retail sales of medical products, including prescription drugs and durable medical equipment.
Even the most inclusive studies of administrative costs have not included at least one key piece of the U.S. health care system, namely, patients.16 The administrative complexity of the U.S. system also burdens patients, whether they are deciphering bewildering bills or shuttling records between providers. Three-quarters of consumers report being confused by medical bills and explanations of benefits.17
A Kaiser Family Foundation survey of people newly enrolled in the health insurance marketplace found that many were not confident in their understanding of the definitions of basic terms and concepts such as “premium,” “deductible,” or “provider network.”18
Insurers and employers spend an estimated $4.8 billion annually to assist consumers with low health insurance literacy, according to the consulting firm Accenture.19
Excess administrative costs
While U.S. administrative care spending is indisputably higher than that of other comparable countries, it’s unclear how much of the difference is excess and how much of that excess could be trimmed.
The NAM report estimated that excess BIR costs amount to $190 billion — $245 billion in current dollars — or roughly half of total BIR expenditures in a year.20
The NAM report estimated that 66 percent of BIR costs for private insurers and 50 percent of BIR costs among providers are excess.21
Based on these percentages, $248 billion of the total $496 billion BIR costs in CAP’s updated estimate are excess administrative costs.
Most studies that have attempted to identify excess costs in the American health care system rely on comparisons between the United States and Canada.22 In their 2010 review of the literature on the difference between the two countries’ health expenditures, economists Alexis Pozen and David M. Cutler looked at the sources of the gap between U.S. and Canadian health spending. They found that 62 percent of the difference between the two countries was attributable to prices and intensity of care, and 38 percent was linked to administrative costs.23
Compared with Canada,
- the United States has 44 percent more administrative staff,
- and U.S. physicians dedicate about 50 percent more time on administrative tasks.24
Inflated to current dollars and today’s population, Pozen and Cutler’s estimate of per capita administrative excess in the United States, when compared with Canada, translates into a gap of $340 billion.25
Woolhandler and Himmelstein estimate that the United States currently spends $1.1 trillion on health care administration, and of that amount, $504 billion is excess.26
Woolhandler and Himmelstein rely on surveys of physicians’ time use and utilized physician income data to translate the share of time physicians spend on administrative tasks into monetary value; their estimate of excess costs is the difference between U.S. and Canadian administrative spending27 Woolhandler and Himmelstein’s original 2003 article estimated that Canada spent $307 per capita on health system administration, compared with $1,059 per capita in the United States.
Assuming this difference is excess requires an assumption that a Canadian-style health care system would achieve an identical level of administrative costs in the United States.
A separate criticism of the original 2003 Woolhandler and Himmelstein estimates, as articulated by Henry J. Aaron, an economist at the Brookings Institution, is that their methodology failed to account for differences in prices.28
Woolhandler and Himmelstein arrive at their national total administrative costs by tallying up costs in each country for items such as rent and salaries. As a consequence, the U.S.-Canada comparison captures not just the differences in the quantity of resources devoted to administration — such as physician time or office space — but also the differences in office rates, wages, and salaries. Taking Woolhandler and Himmelstein’s estimate of total administrative costs as a given and then making standard adjustments for price differences, Aaron argues that the two researchers exaggerated U.S. administrative spending in their 2003 report and that the true portion of excess would be about one-quarter less than what they estimated.
All estimates of administrative costs are inherently sensitive to what portion of health care spending one considers administrative.29 For example, time spent recording diagnosis or prescription information used in billing may also be vital for patient care, allowing medical teams to share up-to-date information or avoid harmful drug interactions.
A recent study of an electronic health records (EHR) system estimated that on average, half of a primary care physician’s day is spent on EHR interaction, including billing, coding, ordering, and communication.30
A recent study of an electronic health records (EHR) system estimated that on average, half of a primary care physician’s day is spent on EHR interaction, including billing, coding, ordering, and communication
Such tasks, however, can fall into a gray area between administrative and clinical. In a separate study, economist Julie Sakowski and her fellow researchers reported finding varying attitudes among physicians about whether interaction with electronic medical records — a subset of EHR — represented administrative or clinical time. As Sakowski and co-authors wrote, “Some felt they spent extra effort adding documentation that was needed only for billing. Others seemed to feel that nearly all of that information was needed for accurate clinical records.”31
Administrative costs for payers
Within the U.S. system, the share of expenditures that are attributable to administrative costs varies greatly by payer.
The BIR costs for traditional Medicare and Medicaid hover around 2 percent to 5 percent, while those for private insurance is about 17 percent.32
The BIR costs for traditional Medicare and Medicaid hover around 2 percent to 5 percent, while those for private insurance is about 17 percent
Some public finance experts, including Robert Book, have argued that the low levels of Medicare overhead are deceptive. Because seniors have relatively high health expenditures, the argument goes, administrative costs make up a relatively small share of their total health care spending. However, Medicare’s per capita administrative expenditures are higher than those in other forms of insurance.33 Even if one compares higher-end estimates of Medicare administrative costs to low-end estimates of costs for private insurance, the gulf between administrative costs for Medicare and private coverage is large.34 Organisation for Economic Co-operation and Development (OECD) data also show that other nations are able to achieve low levels of administrative costs while maintaining universal coverage across all ages of the population.35
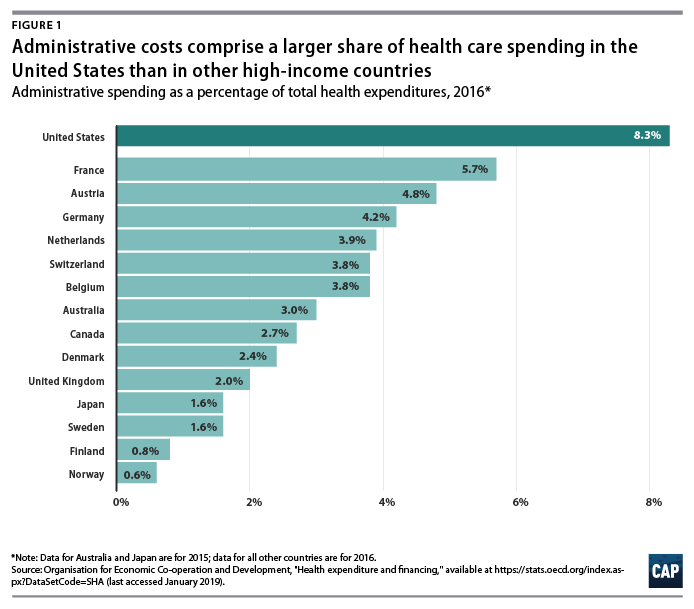
International health system data demonstrate that the United States is a clear outlier on administrative spending.
And while the OECD’s definition includes administrative costs to government, public insurance funds, and private insurance, but not those borne by hospitals, physicians, and other providers, the stark difference is still informative.
In 2016, administration accounted for 8.3 percent of total health care expenditures in the United States — the largest share among comparable nations. (see Figure 1)
Countries with single-payer systems are among those with the lowest administrative costs.
For example, administrative spending accounts for just 2.7 percent of total health care expenditures in Canada.36
OECD data also show that within a country, administrative costs are higher in private insurance than in government-run programs.37
Countries with single-payer systems are among those with the lowest administrative costs.
Countries that have multipayer systems with stricter rate regulation also achieve much lower administrative costs than the United States.
Administrative expenditures account for 4.8 percent of total health care expenditures in Germany, 3.9 percent in the Netherlands, 3.8 percent in Switzerland, and 1.6 percent in Japan, according to the OECD. If the United States could reduce administrative costs down to Canadian levels, it would save 68 percent of current administrative expenditures; reducing to German-level administrative costs would save 42 percent of current administrative expenditures.
However, to assume that by simply adapting another country’s health care system — whether it is Canada’s single-payer Medicare, Germany’s sickness funds, or Switzerland’s heavily regulated private plans — the United States would automatically achieve the same level of administrative costs may ignore other fundamental differences between countries, including the market power of health care providers, political systems, and attitudes toward health care.
Nevertheless, the experience of other multipayer systems such as those in Germany and Switzerland suggests that the United States could substantially reduce both administrative expenditures and overall health care spending by bringing down reimbursement rates and regulating insurance — even while continuing to allow multiple payers and private health care providers.
The lowest possible level of administrative spending for the U.S. health care system is not necessarily the optimal level of spending.
As researchers Robert A. Berenson and Bryan E. Dowd have noted, administrative spending in Medicare may in fact be too low; the program would be more efficient with greater investment in initiatives to lower costs and improve quality.38
Many reforms that could generate overall savings require administrative resources to design and implement. Innovations such as bundled payments — the practice of paying providers a lump sum for an episode of care such as a knee replacement or childbirth rather than reimbursing each individual component — involve upfront investment in development.
Increasing resources to combat fraud and abuse would also lower overall spending.
While the U.S. Department of Health and Human Services (HHS) boasts that it sees a $5 return on every $1 it puts toward fraud and abuse investigations, that number indicates that the government may be underinvesting in those efforts.39
While the U.S. Department of Health and Human Services (HHS) boasts that it sees a $5 return on every $1 it puts toward fraud and abuse investigations, that number indicates that the government may be underinvesting in those efforts.
Administrative costs for health care providers
A number of studies have focused on the administrative costs borne by providers. Beyond BIR expenses, hospitals, physician practices, and other health care institutions house departments that are complementary to clinical services such as medical libraries, public relations, and accounting.40
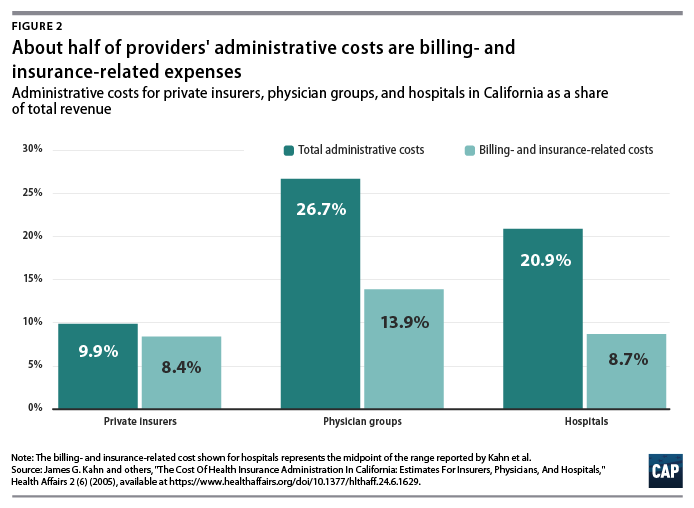
A study of administrative costs in California found that administrative costs represented about one-quarter of physician revenue and one-fifth of hospital revenue, and BIR costs accounted for roughly half of administrative expenditures for physician and hospital services covered by private insurance.41 (see Figure 2)
In a separate study, Himmelstein and others reported that one-quarter of U.S. hospital spending went toward administration; they found little difference between nonprofit hospitals and for-profit institutions, where administrative spending was 25 percent and 27.2 percent of total spending, respectively.42
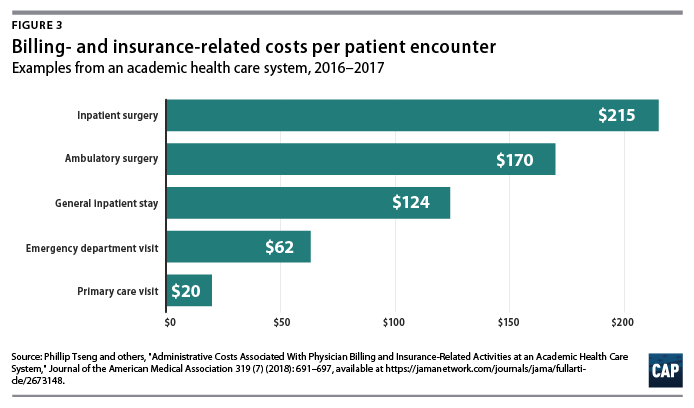
On a per-encounter basis, BIR costs vary as a proportion of overall cost depending on the type of visit.
In a 2018 study of an academic health care system, Phillip Tseng and others found that professional billing costs amounted to $20.49 for a primary care visit, $61.54 for an emergency department visit, and $124.26 for a general inpatient stay.43
Relative to the professional revenue associated with each encounter studied, the emergency department visit ranked the highest, with billing costs equal to 25.2 percent of revenue.
Inpatient visits were the lowest, at 8 percent of a general inpatient stay and 3.1 percent for inpatient surgery.44
Encounters involving hospital care incurred additional facility-level billing costs. (see Figure 3)
In addition to the dollar cost of BIR activity, the study also reported the time spent on administration for typical encounters.
The average processing time was 13 minutes for a primary care visit, 32 minutes for an emergency department visit, and 73 minutes for a general inpatient stay.45
The average processing time was 13 minutes for a primary care visit, 32 minutes for an emergency department visit, and 73 minutes for a general inpatient stay
Among other research on provider BIR costs, a 2009 study by Larry Casalino and others estimated that the cost of the time physicians spend on interactions with health plans is about $23 billion to $31 billion per year.46
A 2011 study by Dante Morra of the University of Toronto and others estimated that interaction with payers costs the equivalent of $22,205 per physician annually in Canada and $82,975 per physician annually in the United States, suggesting that the United States would save $27.6 billion annually if U.S. administrative costs could be brought down to Canadian levels.47
As with BIR costs, provider administrative costs in the United States are higher than those in other comparable countries. Hospital administrative costs in the United States far exceed those of other nations. In their comparison of hospital administrative costs among eight Western nations, Himmelstein and co-authors found that the United States had the highest levels, at 25.3 percent of total hospital expenditures.48
They conclude that in nations where hospital administrators have minimal responsibilities for procuring financing and where the hospital reimbursement system is least complex, administrative costs can be reduced to 12 percent of expenditures.49
These findings suggest that reforms that introduce global budgeting or limit the need to bargain with multiple payers could potentially bring down excess hospital administrative costs in the United States.
Lower administrative costs in single-payer and multipayer systems
Although administrative costs contribute to the high expenditures in the United States, they are not the primary reason for the health care spending gap.
As economist Uwe Reinhardt and others candidly put it, “It’s the prices, stupid.”50 The United States pays more for care than other countries do — both for administrative services and for other components of health care.
“It’s the prices, stupid.”
The United States pays more for care than other countries do — both for administrative services and for other components of health care.
Policies that target administrative costs alone would not necessarily bring overall U.S. health care expenditures in line with other countries.
As economists Sherry Glied and Adam Sacarny observed, “there are very substantial variations in administrative costs among countries with universal health insurance, which do not translate directly into variations in overall costs.”51
Comparative evidence from U.S. states also suggests that America’s multipayer system explains some, but by no means all, of the discrepancy between the United States and other developed nations.
University researchers Joseph P. Newhouse and Anna Sinaiko observe that “there is considerable variation across the states in spending levels, with the lowest quintile of states spending approximately the same percentage as the higher spending OECD countries other than the U.S.
This implies that the [United States’] pluralistic financing system may not be an important cause of the large percentage of GDP that the U.S. devotes to health care.”52
Systemwide reforms to lower administrative costs
Health care financing experts believe that changes to how Americans pay for coverage could dramatically reduce administrative costs.
Researchers simulating the effects of single-payer programs have assumed that administrative costs would be brought down substantially.
The Urban Institute set administrative costs at a “plausible” 6 percent of health care claims for their simulation of the single-payer plan proposed by Sen. Bernie Sanders (I-VT), noting that they “do not believe that administrative costs can fall far below this level; far too many administrative functions must be conducted.”53
In its analysis of a single-payer system for New York state, the RAND Corporation assumed administrative costs at 6 percent of total health expenditures in its base case, representing a reduction from 18 percent among commercial insurers and 7 percent in New York’s Medicaid program.
RAND specified administrative costs at 13 percent and 3 percent in its alternative scenarios. 54 In a separate column, however, RAND researcher Jodi Liu cautioned that achieving the administrative expenditure levels of other countries “may be aspirational and is not guaranteed” under a single-payer system.55
Exactly how such lower costs could be achieved is another question.
Reducing BIR costs requires simplifying the billing and payment process, which could be accomplished in a number of ways.
Two avenues for reducing administrative costs as well as overall health costs are global budgeting and uniform rate-setting.56
Two avenues for reducing administrative costs as well as overall health costs are global budgeting and uniform rate-setting.
These two concepts are central to health systems around the world and are also responsible for keeping administrative costs lower, whether a country has a multipayer or single-payer system.
Another paperwork-reducing option would be a centralized claims clearinghouse to allow providers to submit all claims to a single entity, as they do in Germany and Japan. 57
Another paperwork-reducing option would be a centralized claims clearinghouse to allow providers to submit all claims to a single entity, as they do in Germany and Japan.
All-payer rates and global budgeting
Setting all-payer reimbursement rates would eliminate the need for providers to negotiate rates with individual private insurers, while also giving policymakers better leverage for controlling overall health care cost growth.
In the current U.S. system, providers charge different rates to different payers, and the billing process is complicated and opaque.
The list prices that hospitals are now required to publish bear little connection to what individual patients — or those patients’ insurers — actually pay.58
Setting all-payer rates would simplify billing and improve transparency by establishing a single set of rates for each provider, while also giving regulators a tool to protect consumers from exorbitant rates.59
Global budgeting — the practice of paying providers revenue based on their expected costs — also holds promise for both lowering administrative spending and overall costs.
As opposed to traditional fee-for-service payments, which reward providers for doing more, global budgeting incentivizes providers to deliver care more efficiently.60
Global budgeting is a feature of many countries with much lower health care administrative costs, including Scotland, Wales, and Germany.61
As Woolhandler, Campbell, and Himmelstein point out in their 2003 article, “The existence of global budgets in Canada has eliminated most billing and minimized internal cost accounting, since charges do not need to be attributed to individual patients and insurers.”62
As Germany shows, both single-payer and multipayer systems can use global budgets.
A system combining all-payer rates and global budgeting is already partially in place in the state of Maryland, where each hospital has a single set of rates it bills to Medicare, Medicaid, commercial insurers, and other payers.
Maryland’s system is keeping overall cost growth lower than the national trend.63 According to RAND analysis of hospital costs, Maryland hospitals have administrative costs that are 9 percent lower than the national average and not far off from the 13 percent savings RAND assumed providers would achieve under a single-payer system. 64
Centralized claims processing
Germany and Japan both have multiple payers but centralized claims processing.65 Despite having more than 3,000 health plans,66 Japan’s administrative expenditures were a stunningly low 1.6 percent of overall health care costs in 2015, one of the lowest among OECD member nations.67
Germany and Japan both have multiple payers but centralized claims processing.65 Despite having more than 3,000 health plans,66 Japan’s administrative expenditures were a stunningly low 1.6 percent (2015) …
In their analysis of three universal health care options for Vermont, including single payer, researchers William C. Hsiao, Steven Kappel, and Jonathan Gruber estimated substantial savings from administrative simplicity from each option.
The two single-payer options they examined would result in even greater administrative savings of between 7.3 percent and 7.8 percent, depending on the rate-setting mechanism.68
The group estimated that a third scenario, which would establish a centralized claims clearinghouse while allowing multiple payers, could generate savings equal to 3.6 percent of total expenditures.69
This suggests that about half of the total administrative savings from a single-payer system could be obtained within a regulated multipayer system.
Policy proposals directed at administrative costs
While major changes to the U.S. health care system have the greatest potential to bring down costs, more incremental changes could reduce administrative waste.
A recent bill proposed by Sens. Bill Cassidy (R-LA) and Tina Smith (D-MN) would direct the HHS secretary to set goals to cut “unnecessary costs and administrative burdens” throughout the health care system by 50 percent over the next 10 years.
It would also provide grant money for state-based efforts to bring down administrative costs.70
Some possible avenues for achieving those kinds of reductions include changes to payment rules, improvements to facilitate electronic record-keeping and information exchange, and simplification of public insurance programs.
Some possible avenues for achieving those kinds of reductions include changes to payment rules, improvements to facilitate electronic record-keeping and information exchange, and simplification of public insurance programs.
In their 2009 article in The New England Journal of Medicine, David Cutler, Elizabeth Wikler, and Peter Basch proposed one such package of reforms.
The authors estimated that providers could save $17.9 billion to $23 billion annually with several, more incremental changes to the system, including greater adoption of EHR systems; integrated administrative and clinical systems; national and standardized reporting requirements and credentialing of providers; streamlined enrollment in public insurance programs; and greater automation.71
In a separate report, the same authors proposed additional reforms that they estimated could reduce excess administrative costs by $40 billion, or 25 percent of total health care expenditures.72
In a 2010 study published in Health Affairs, Bonnie B. Blanchfield and other Massachusetts researchers concluded that the administrative burden on physician organizations could be reduced by a “single transparent set of payment rules for a system with multiple payers.”
The authors recommended that the United States adopt “a standard set of payment requirements, increased payment-rule transparency, standardized forms, and a standard set of data exchange requirements.”
Doing so could save $7 billion in billing costs for physician and other clinical services, according to the authors’ estimates.73
Conclusion
Although estimates vary, a large body of evidence shows that the United States is spending about twice as much as needed on the administration of health care.
Other nations enjoy world-class health care systems while spending a fraction of what the United States does on governance, billing, and insurance.
A structural overhaul of how health care is financed and priced that includes key features of other countries’ systems — whether one payer or many — would go a long way toward eliminating excess administrative costs.
Simplifying the payment system should be an essential part of future health reform and would make the U.S. system work better for taxpayers and patients alike.
About the authors
Emily Gee is the health economist of Health Policy at the Center for American Progress.
Topher Spiro is the vice president for Health Policy and a senior fellow for Economic Policy at the Center.
This publication was made possible in part by a grant from the Peter G. Peterson Foundation. The statements and the views expressed are solely the responsibility of the Center for American Progress.
References
See the original publication !
APPENDIX 3
PHYSICIAN TIME SPENT ON REPORTING QUALITY MEASURES: $ 17.6 billion
Health Affairs
Lawrence P. Casalino, David Gans, Rachel Weber, Meagan Cea, Amber Tuchovsky, Tara F. Bishop, Yesenia Miranda, Brittany A. Frankel, Kristina B. Ziehler, Meghan M. Wong, and Todd B. Evenson
March 2016
Abstract
Each year US physician practices in four common specialties spend, on average, 785 hours per physician and more than $15.4 billion dealing with the reporting of quality measures.
While much is to be gained from quality measurement, the current system is unnecessarily costly, and greater effort is needed to standardize measures and make them easier to report.
The number of quality measures directed at US health care providers by external entities such as Medicare, Medicaid, and private health insurance plans has increased rapidly during the past decade. 1–3
These measures, such as rates of mammography screening for women or of testing for cholesterol or hemoglobin A1c levels for diabetes, are used to provide publicly reported information for patients and as a basis for financial “pay-for-performance” incentives to physicians.
At least 159 measures of outpatient physician care are now publicly available. 1
The movement toward accountable care organizations, the federal Sustainable Growth Rate “fix” legislation, 4 and the private-sector Catalyst for Payment Reform coalition will further emphasize measurement of physician performance. 5
The number of quality measures directed at US health care providers by external entities … and private health insurance plans has increased rapidly during the past decade.
At least 159 measures of outpatient physician care are now publicly available.
Anecdotally, dealing with these measures imposes a considerable burden on physician practices in terms of understanding the measures, providing performance data, and understanding performance reports from payers, 6 but the extent of that burden has not been quantified. 7
We present results from a national survey of practices representing three common physician specialty and multispecialty practices.
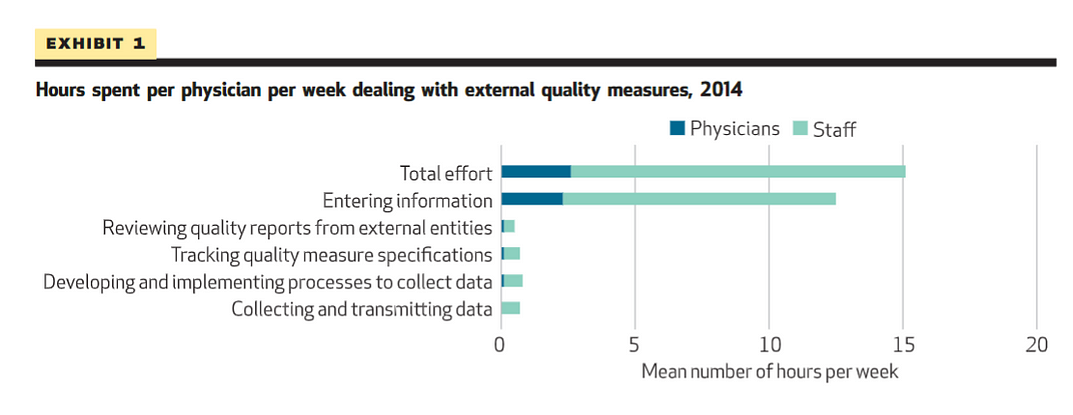
Practices reported that their physicians and staff spent 15.1 hours per physician per week dealing with external quality measures including the following: tracking quality measure specifications, developing and implementing data collection processes, entering information into the medical record, and collecting and transmitting data ( Exhibit 1 ).
Practices reported that their physicians and staff spent 15.1 hours per physician per week dealing with external quality measures including the following
This is equivalent to 785.2 staff and physician hours per physician per year.
The average physician spent 2.6 hours per week (enough time to care for approximately nine additional patients) dealing with quality measures; staff other than physicians spent 12.5 hours per physician per week dealing with quality measures, with the largest proportion (6.6 hours) by licensed practical nurses and medical assistants ( Exhibit 2 ).
The average physician spent 2.6 hours per week …staff other than physicians spent 12.5 hours per physician per week dealing with quality measures, with the largest proportion (6.6 hours) by licensed practical nurses and medical assistants.
Exhibit 1 Hours spent per physician per week dealing with external quality measures, 2014
SOURCE Authors’ analysis of responses to web-based survey of physician practices conducted for this research.
Exhibit 2 Mean hours spent on specific activities related to external quality measures per physician per week, 2014–15
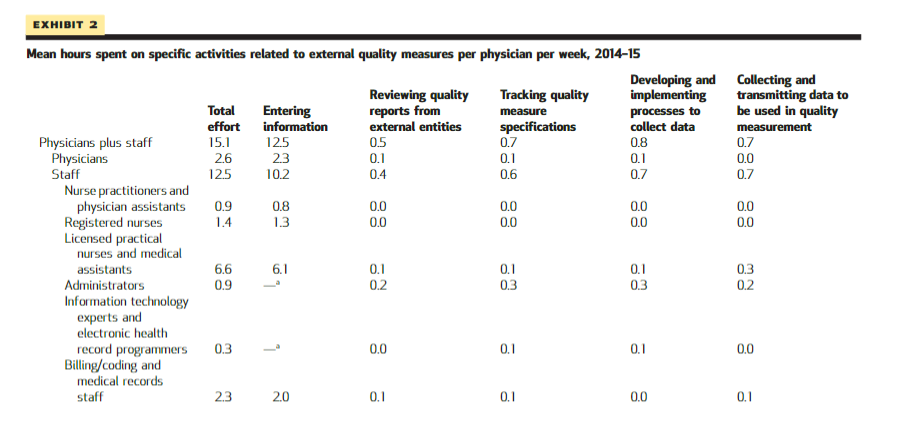
SOURCE Authors’ analysis of responses to web-based survey of physician practices conducted for this research. NOTE Statistical significance testing was not performed on the values in this exhibit.
The per physician time spent by physicians and staff translates to an average cost of $40,069 per physician per year ( Exhibit 3 ), or a combined total of $15.4 billion annually for general internists, family physicians, cardiologists, and orthopedists in the United States. (See online Appendix A1 for the methods used to calculate costs.) 8
The per physician time spent by physicians and staff translates to an average cost of $40,069 per physician per year , or a combined total of $15.4 billion annually …
Eighty-one percent of practices reported that they spent more or much more effort dealing with external quality measures than three years ago ( Exhibit 4 ).
However, only 27 percent believed that current measures were moderately or very representative of the quality of care.
Exhibit 3 Average amount spent per physician per year dealing with external quality measures, 2014–15
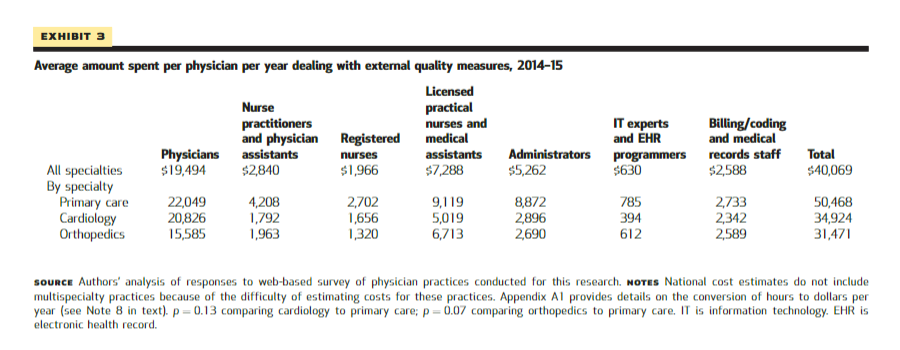
SOURCE Authors’ analysis of responses to web-based survey of physician practices conducted for this research. NOTES National cost estimates do not include multispecialty practices because of the difficulty of estimating costs for these practices. Appendix A1 provides details on the conversion of hours to dollars per year (see Note 8 in text). p=0.13 comparing cardiology to primary care; p=0.07 comparing orthopedics to primary care. IT is information technology. EHR is electronic health record.
Exhibit 4 Physician practices’ perceptions of external quality measures, 2014
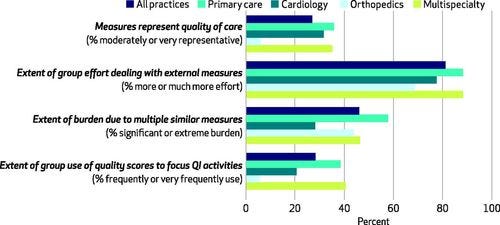
SOURCE Authors’ analysis of responses to web-based survey of physician practices conducted for this research. NOTES Responses were on a 5-point Likert scale. For example, for the first item, respondents chose between responses ranging from “not at all representative of the quality of care” to “very representative of the quality of care.” QI is quality improvement.
External entities measure practices’ performance using both claims data and data that practices directly provide, such as patients’ blood pressure levels. 9
These entities often specify measures slightly differently than each other for the same area of performance.
For example, for diabetes care, the Medicare Shared Savings Program metric for poor diabetes control is hemoglobin A1c at or below 8 percent, whereas most health plans use the Healthcare Effectiveness Data And Information Set (HEDIS) standard of at or below 9 percent. 10(p1458)
This complicates practices’ data collection, reporting, and review processes. 1,10 State and regional agencies currently use 1,367 measures of provider quality, of which only 20 percent are used by more than one state or regional program. 11
A study of twenty-three health insurers found that 546 provider quality measures were used, few of which matched across insurers 10 or with the 1,700 measures used by federal agencies. 1
Study Data And Methods
See the original publication !
Study Results
At least 90 percent of practices in each specialty received data on quality from external entities; between 70.9 percent (orthopedics) and 91.7 percent (primary care) of practices expended effort dealing with external quality measures ( Exhibit 5 ).
On average, physicians and staff spent a total of 15.1 hours per physician per week dealing with quality measures, with the average physician spending 2.6 hours per week and other staff spending 12.5 hours ( Exhibits 1 and 2 ).
Exhibit 5 Characteristics of responding physician practices surveyed about external quality measures, 2014–15
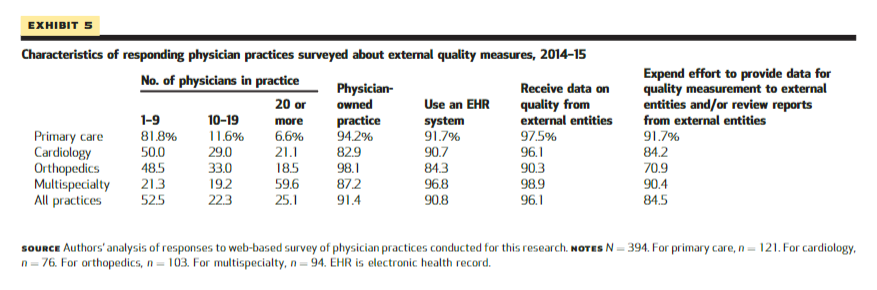
SOURCE Authors’ analysis of responses to web-based survey of physician practices conducted for this research. NOTES N=394 . For primary care, n=121 . For cardiology, n=76 . For orthopedics, n=103 . For multispecialty, n=94 . EHR is electronic health record.
By far the most time — 12.5 hours of physician and staff time per physician per week — was spent on “entering information into the medical record ONLY for the purpose of reporting for quality measures from external entities” ( Exhibit 2 ).
The average physician spent 2.3 hours per week entering this information. Licensed practical nurses and medical assistants spent the largest amounts of time — 6.1 hours per physician per week — entering information.
Primary care physicians spent 3.9 hours per week dealing with quality measures, compared to 1.7, 1.1, and 3.0 hours for cardiologists, orthopedists, and physicians in multispecialty groups, respectively ( Exhibit 6 ).
Primary care practices spent 19.1 hours of physician and staff time per physician per week dealing with quality requirements of external entities; cardiology, orthopedic, and multispecialty practices spent 10.4, 11.3, and 17.6 hours per physician per week, respectively. Time spent varied little by practice size (Appendix A3). 8
Exhibit 6 Mean hours spent per physician per week in dealing with external quality measures, 2014–15
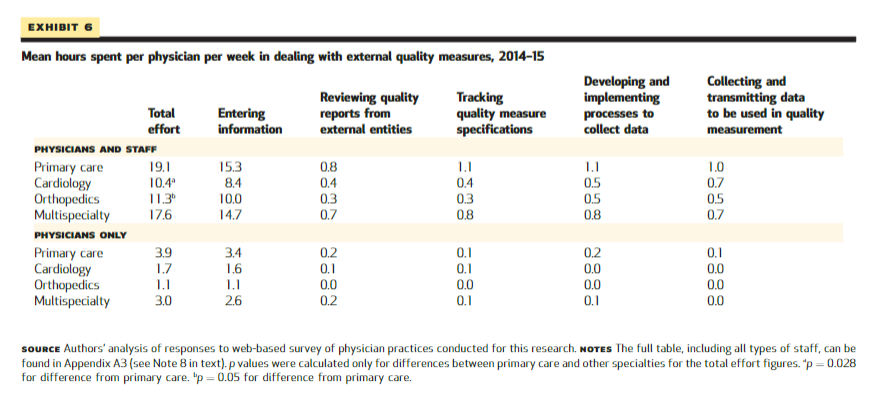
SOURCE Authors’ analysis of responses to web-based survey of physician practices conducted for this research. NOTES The full table, including all types of staff, can be found in Appendix A3 (see Note 8 in text). p values were calculated only for differences between primary care and other specialties for the total effort figures. ap=0.028 for difference from primary care. bp=0.05 for difference from primary care.
The time spent by physicians and staff translates to an average cost to a practice of $40,069 per physician per year ( Exhibit 3 ).
Primary care practices spent $50,468, compared to $34,924 for cardiology practices and $31,471 for orthopedics practices.
If the dollar amounts per physician per year are multiplied by the number of general internists, family physicians, cardiologists, and orthopedists in the United States, the total amount spent annually by physician practices in these specialties dealing with external quality measures is $15.4 billion (Appendix A1). 8 The total amount spent by physicians in all specialties would be higher.
Eighty-one percent of practices reported that the effort they spent on quality measures was increasing compared to three years ago ( Exhibit 4 ).
Forty-six percent reported that it was a significant burden to deal with measures that were similar but not identical to each other.
Only 27 percent believed that current measures were moderately or strongly representative of the quality of care.
Just 28 percent used their quality scores to focus their quality improvement activities.
Specialty practices — especially orthopedic practices — were much less likely than primary care or multispecialty practices to report that measures were representative of quality or to use them to focus their attempts to improve quality.
Comments from specialist respondents — especially orthopedic practices — argued that most quality measures were relevant for primary care but not for their specialty (Appendix A4). 8
In the free-text section of the survey, 228 practices (58 percent) provided 308 comments.
Five major themes recurred:
- the burden of current measurement requirements on small practices,
- recommendations to have measures that are uniform across entities,
- the need for specialty-specific measures,
- the need for measures that better represent quality, and
- the need to easily and accurately extract data from electronic health records (EHRs)
(see Appendix A4). 8
Discussion
The cost to physician practices of dealing with quality measures is high and rising.
Our time and cost estimates of 15.1 hours per physician per week and $15.4 billion per year for the specialties included are much higher than those from a 2006 survey that included a single question about quality measures and from two early studies of small numbers of practices. 12,17,18
The methods used across the studies varied; in addition, the burden of dealing with quality measures has almost certainly increased since they were conducted.
There is much to gain from quality measurement, but the current system is far from being efficient and contributes to negative physician attitudes toward quality measures. 19
Improving the system rapidly will be difficult. Obstacles include
- the fragmented US health care system,
- lack of interoperability across EHRs,
- lack of EHR functionalities to facilitate retrieval of data for quality measures,
- the cost of change to external entities and to providers, and
- opposition from vested interests. 5
Increasing efforts to reduce the number of measures and to standardize their use across external entities are being made by
- the National Quality Forum, the Institute of Medicine, and
- America’s Health Insurance Plans, as well as
- by federal agencies such as the Centers for Medicare and Medicaid Services and
- the Agency for Healthcare Research and Quality. 5,20–23
Our data suggest that US health care leaders should make these efforts a priority.
Acknowledgements
The Physicians Foundation funded this research. The authors thank Rachel Jawahar of Weill Cornell Medical College for her assistance with data analysis for this project. Lawrence Casalino serves on the boards of directors of the American Medical Group Foundation and of the Healthcare Research and Education Trust, on the American Hospital Association Committee on Research, and on the Advisory Committee for the American Medical Association’s physician professional satisfaction and practice sustainability project.
References
See the original publication !
About the authors
Lawrence P. Casalino, David Gans, Rachel Weber, Meagan Cea, Amber Tuchovsky, Tara F. Bishop, Yesenia Miranda, Brittany A. Frankel, Kristina
Lawrence P. Casalino is the Livingston Farrand Professor of Public Health and chief of the Division of Health Policy and Economics in the Department of Healthcare Policy and Research at Weill Cornell Medical College, in New York City.
David Gans is a senior fellow at the Medical Group Management Association, in Denver, Colorado.
Rachel Weber is a data analyst at the Medical Group Management Association.
Meagan Cea is a research coordinator in the Department of Healthcare Policy and Research at Weill Cornell Medical College.
Amber Tuchovsky is a data analyst at the Medical Group Management Association.
Tara F. Bishop is an associate professor in the Department of Healthcare Policy and Research at Weill Cornell Medical College.
Yesenia Miranda is a research coordinator in the Department of Healthcare Policy and Research at Weill Cornell Medical College.
Brittany A. Frankel is a medical student at Weill Cornell Medical College.
Kristina B. Ziehler is an assistant director at the Medical Group Management Association.
Meghan M. Wong is an assistant director at the Medical Group Management Association.
Todd B. Evenson is chief operating officer at the Medical Group Management Association.
Originally published at https://www.healthaffairs.org
TAGS: health issues, waste, administrative waste, burnout (physician burnout)
health strategies, automation, KPIs simplification;