The Health Foundation
Sebastien Peytrignet, Jay Hughes, Ellen Coughlan, Josh Keith, Tim Gardner, Charles Tallack
28 July 2022
Key points:
Waiting times for planned hospital care in England were worsening before the start of the pandemic, and things have now got considerably worse.
- The waiting list grew by almost 50% to 6.4 million by March 2022 and
- for the people waiting, the median wait had increased from 7.5 weeks to 12.0 weeks.
To help deal with this, the NHS is planning to increase the number of treatments delivered by 30% (compared with before the pandemic).
- As a way of expanding capacity, the NHS has entered into new arrangements for treating patients in independent sector health care providers (ISPs).
Before the pandemic, ISPs delivered around 12% of total NHS-funded planned treatments requiring hospital admission and 7% of outpatient treatments.
- The proportion varies by specialty.
- For care requiring hospital admission, the specialities with the greatest shares of ISP delivery were
– trauma and orthopaedics (23%),
– gastroenterology (20%) and
– ophthalmology (18%).
The overall share of care delivered by ISPs is higher now than it was before the pandemic.
- For care requiring hospital admission, the volume of ISP-provided care has grown by 9%, equating to an increase in share from 12% to 16%.
- At the same time, NHS volumes have fallen by 17% and the total number of treatments is 14% lower.
- The share of care delivered by ISPs has grown most in ophthalmology, from 18% to 34%.
But even here overall treatment volumes have still only just recovered to pre-pandemic levels — with the growth in ISP care closely matching a reduction in NHS provided care. - In some specialties, notably gastroenterology, the ISP share has fallen.
These findings raise questions about the contribution that the independent sector can make to increasing overall volumes of care.
- The share of care delivered by ISPs varies across regions of the country — based on provider location — ranging from 7% in London to 21% in Yorkshire and the Humber,
- and by an area’s level of deprivation — it is 11% in the most deprived fifth of areas and 25% in the least deprived.
- If the independent sector further increases the share of NHS-funded care it delivers, these findings raise questions about whether different areas of the country will have equal access to care.
Introduction
Elective care — planned, non-urgent specialist care, including surgery, diagnostic procedures and outpatient appointments — is a hugely important part of NHS activity.
A total of 15.2 million elective care treatments were started in 2021/22, equivalent to around one treatment for every four people in England.
The coronavirus pandemic has severely disrupted routine NHS services.
As hospitals have faced increased demand for COVID-19 care, and more staff shortages due to sickness, lots of elective care has been postponed to help the NHS cope with these urgent pressures.
The health service has learned and adapted as the pandemic has progressed, gradually reducing overall disruption, but it has nonetheless continued to have a substantial impact.
This disruption saw the number of people waiting to start treatment rise from 4.4 million in February 2020 to 6.4 million in March 2022.
Over the same period, the median waiting time for those on the waiting list increased from 7.5 weeks to 12.0 weeks.
For many of these patients, waiting for care takes a toll on mental health and pain levels, and inhibits people’s ability to work or to carry out household tasks.
We all know someone on a hospital waiting list.
Whether they need diagnostic procedures, planned (non-urgent) surgery or outpatient check-ups, the delays to elective care can have a big impact on patients.
So can private providers deliver more NHS-funded care to relieve pressure and reduce waiting times?
Tackling the elective care backlog is currently a major government priority.
In February this year, NHS England published their elective care recovery plan, which aims to eliminate all waits over 52 weeks by March 2025.
To achieve this, activity is expected to reach 130% of pre-pandemic levels.
As things stand, this is to be funded by the new Health and Social Care Levy — an increase in National Insurance.
And, to support that aim and help tackle the backlog, the NHS has arranged to treat more patients via independent sector health care providers.
There is also a strong commitment to ‘inclusive recovery’, with system plans expected to set out how any health inequalities identified will be reduced as part of recovery efforts.
The drive to use the independent sector has not been without criticism, with concerns raised about the impact on value for money, inequalities and the NHS workforce, for example.
On top of this, NHS England announced in June that patients are being offered the choice to travel further afield and receive care in different regions, to help ensure that by the end of July no one is waiting more than 2 years for treatment.
Some of this care is being delivered by the independent sector.
On top of this, NHS England announced in June that patients are being offered the choice to travel further afield and receive care in different regions,to help ensure that by the end of July no one is waiting more than 2 years for treatment.
Some of this care is being delivered by the independent sector.
Given the role anticipated for the independent sector in elective care recovery, this analysis explores
- the sector’s role to date,
- looks at how this has changed since the pre-pandemic period, and
- considers what it might mean for patients waiting for different types of treatments, and
- living in different parts of England.
To do this we use aggregate data on consultant-led referral treatment waiting times published each month by NHS England.

What is independent sector elective care?
Private health care companies — independent sector health care providers (ISPs) — have been contributing to the delivery of NHS-funded elective care since the early 2000s.
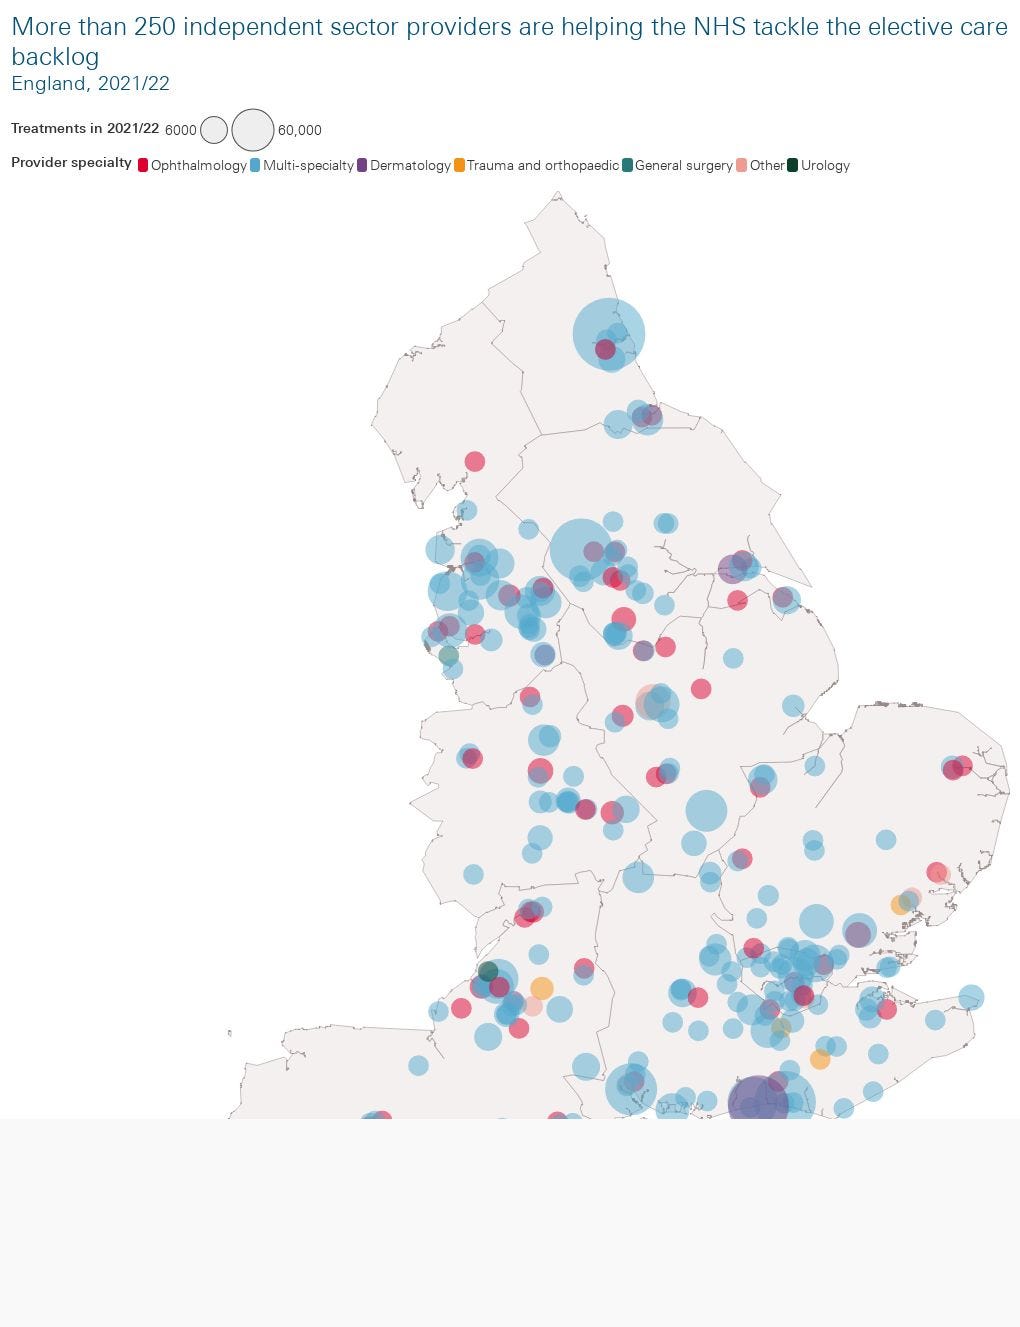
Around 250 ISPs provide elective care at Independent Sector Treatment Centres (treating only NHS-funded patients) or private hospitals.
Independent sector providers of NHS-funded care differ from NHS providers in several ways.
First, while most providers across the NHS and independent sector provide care that covers multiple specialties, independent sector providers tend to cover a narrower range of specialties than NHS counterparts.
For example, around one in four (23%) independent sector providers of NHS-funded care cover only ophthalmology.
Second, these providers are not evenly distributed across the country.
As Figure 1 shows, there are concentrations of independent sector providers of NHS-funded care in London and the North West of England.
What are the overall trends in independent sector delivery of NHS-funded care?
To understand the role the independent sector has been playing, and how it has changed, we have looked at three time periods:
- The period immediately before the pandemic, from April 2018 to February 2020.
- The period between March 2020 and May 2021, covering the first two waves of COVID-19 and the initial rollout of the vaccination programme, ending in May 2021 when the number of patients in hospital with COVID-19 reached a low.
- The period from June 2021 to March 2022. While high numbers of COVID-19 cases and hospitalisations persisted, during this period there were far fewer deaths from COVID-19 as a result of increases in vaccine coverage, improvements in treatment and the nature of new variants. It has also been during this period that the policy focus has increasingly shifted towards ‘recovery’.
We primarily focus on comparisons between the first and third of these periods. We also differentiate between:
- Admitted care — where people are admitted to hospital for treatment (either as inpatients, or day-admission cases).
- Non-admitted care — where people are not admitted to hospital, but instead receive treatment via outpatient clinics (for example).
Figure 2 shows that for admitted care, total numbers of treatments started have not returned to pre-pandemic levels, but the proportion of treatments delivered by the independent sector has stabilised at a higher level than before the pandemic (an average of 16% between June 2021 and March 2022 compared with an average of 12% in the pre-pandemic period).
In the period since June 2021 the average number of monthly treatments was 14% lower than the pre-pandemic level. For NHS-provided care it was 17% lower, while for independent sector care it was 9% higher.
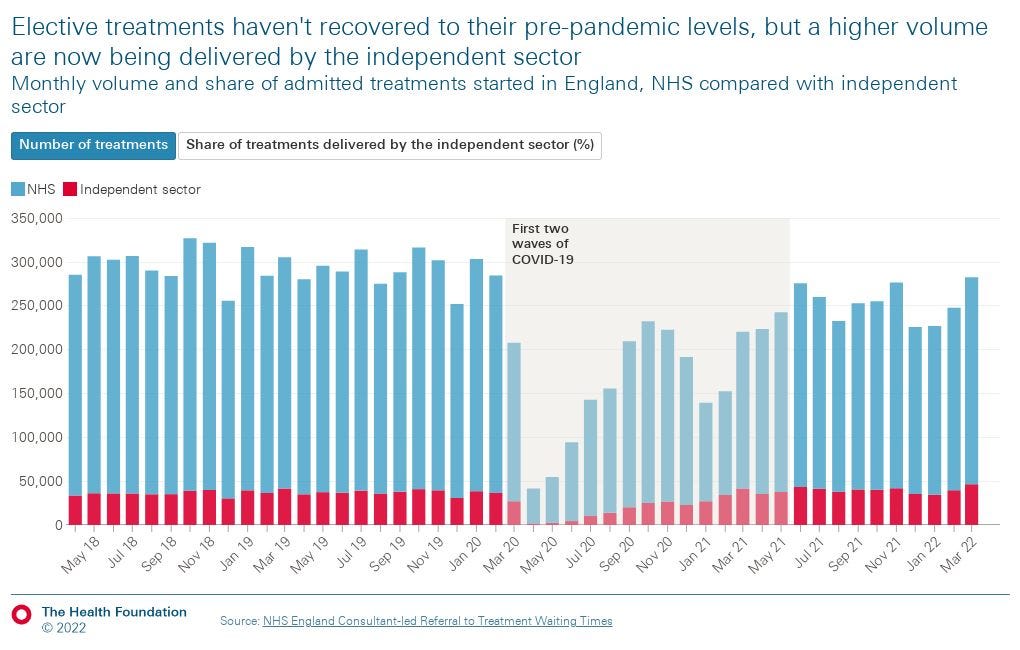
For non-admitted care (which accounts for around four times more activity than admitted care), this pattern is not repeated. Overall volumes have largely recovered, which is unsurprising as a greater share of non-admitted care can be provided remotely or via outpatient clinics. The proportion of treatments delivered by the independent sector is also similar to pre-pandemic levels, at 7%, and much lower than for admitted care.

What are the specific trends in elective care delivery by specialty?
Given the narrower range of specialties covered by many independent sector providers, it is important to look at how things have changed at a specialty level, not just at overall trends.
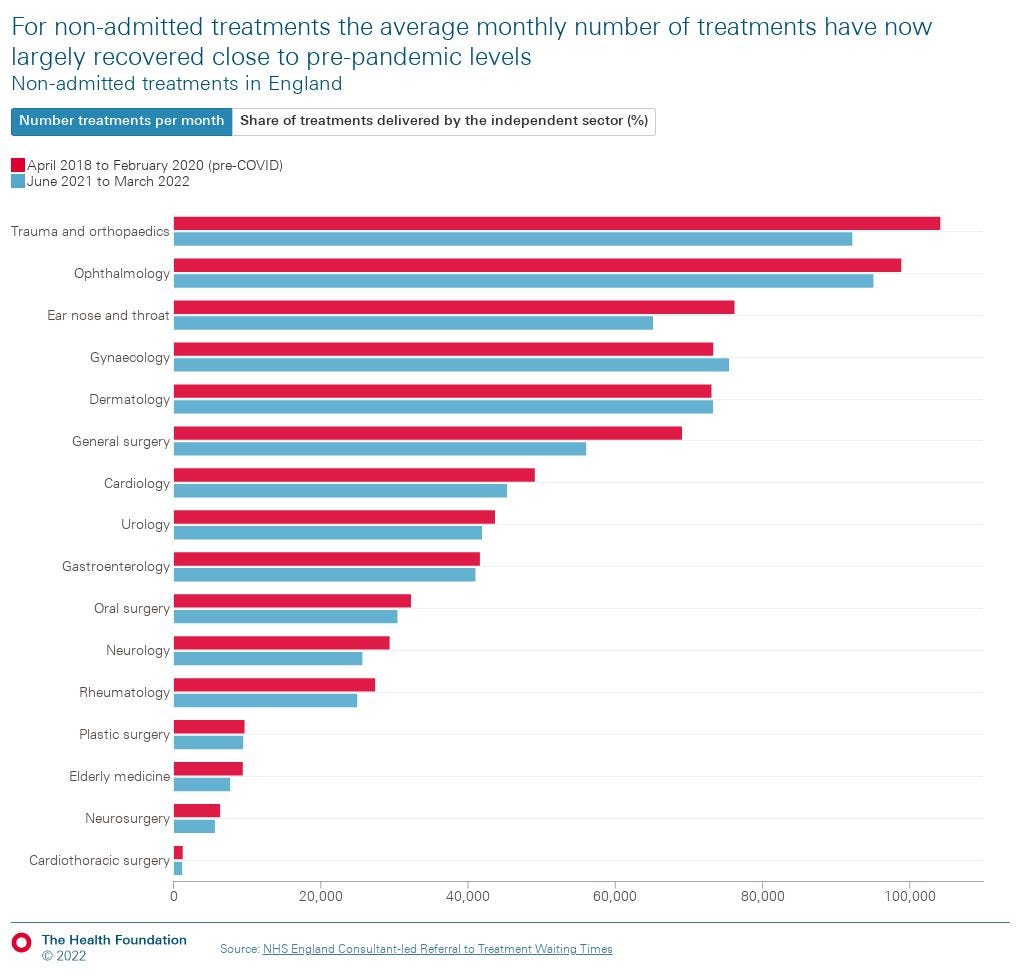
The volume and proportion of elective care delivered by the independent sector differs enormously across specialties. The following figures show the average number of treatments started per month and the proportion delivered by the independent sector for the pre-pandemic period and for the period since June 2021. We show this first for admitted (Figure 3a) and then non-admitted (Figure 3b) treatments by specialty.
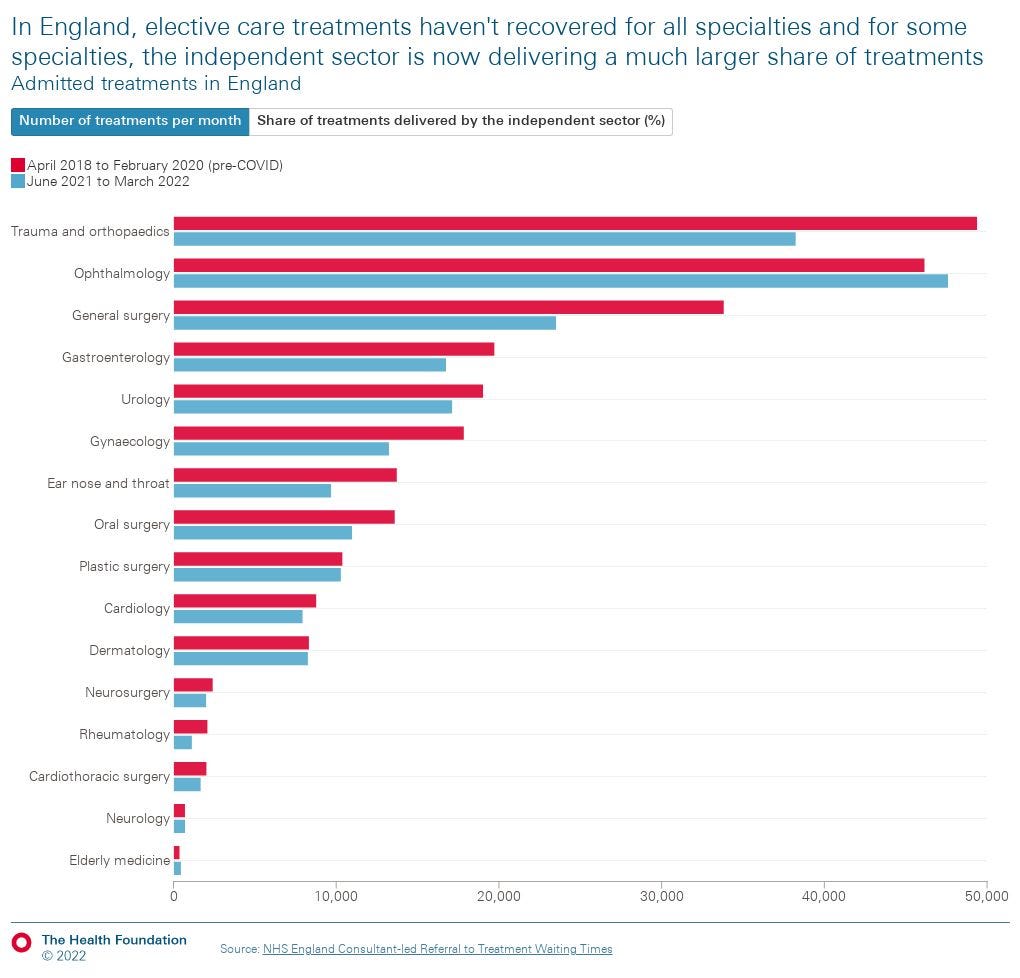
For most specialties, the average number of admitted treatments started each month had not yet fully recovered to pre-pandemic levels as of March 2022, though ophthalmology is a notable exception. Considerable reductions in activity volumes have been observed in some areas, such as trauma and orthopaedics (23% lower than pre-pandemic) and general surgery (31% lower). Yet while there have, generally, been only small changes in the overall number of treatments being delivered by the independent sector, these have sometimes translated into substantial shifts in the proportion of treatments this represents — in the case of ophthalmology almost doubling to 34% (in admitted settings).
For non-admitted treatments the average monthly volume did not fall as steeply as for admitted treatments during the period between March 2020 and May 2021, and volumes have now largely recovered close to pre-pandemic levels. The pattern of changes in the proportion of treatments delivered by the independent sector mirror those seen with admitted treatments, with the biggest changes seen in gastroenterology (6.3 percentage point decrease), and ophthalmology (3.9 percentage point increase).

How has the independent sector’s contribution changed over time for different specialties?
Given the variation across different specialties, to understand more about how the role of the independent sector has been changing, and what implications this might have for ongoing efforts to tackle the elective care backlog, we now focus on patterns for admitted treatments started. We have chosen to narrow the focus in this way given the much higher proportion of NHS-funded admitted care the independent sector provides here (16% in March 2022) compared with non-admitted care (7%).
In terms of specialties, we focus on those where there have been the biggest changes in the proportion of care being delivered by the independent sector — ophthalmology (eg cataract surgery), gastroenterology (eg endoscopies), and trauma and orthopaedics (eg hip or knee replacements). This is important as it is an indication of a shift in where care is being delivered, which may have implications for patient outcomes and care quality, but could also help us understand the role the independent sector can play in addressing the elective care backlog.

Ophthalmology
Ophthalmology (Figure 4a) is the specialty that has seen the largest increase in the share of treatments delivered by the independent sector. This was steadily increasing before the pandemic, and this trend has continued in the period since June 2021. In this period, the independent sector has, on average, been responsible for 34% of all admitted ophthalmology treatments, almost double the average in the pre-pandemic period (18%).
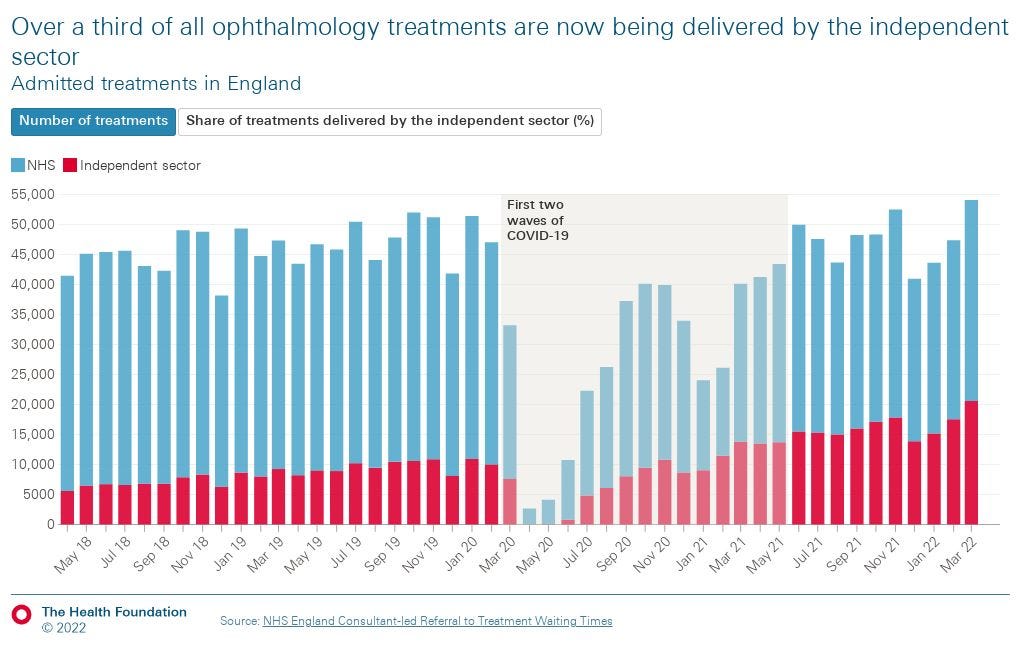
Two factors are contributing to this increase. First, the number of treatments delivered by the independent sector has increased, driven in part by 31 providers beginning to provide NHS-funded ophthalmology care between 2020 and 2021. In the first 3 months of 2022, independent sector providers were responsible for around 26,800 treatments started each month — more than twice the volume than in the same period in 2019 (13,000 treatments started per month). Second, the monthly volume of ophthalmology treatments started by NHS providers has remained below pre-pandemic levels.
These two factors are important. They suggest that despite the growth in the volume of treatments the independent sector is responsible for, there has been no increase in overall volumes compared to the pre-pandemic period. The implications of this are slightly unclear. It is possible that the extra activity being delivered by the independent sector is helping to keep activity levels higher than they would have been otherwise, or that some activity that would have happened in the NHS has been displaced to the independent sector. Either way, activity levels are still short of the aim to hit 130% of pre-pandemic levels.

Gastroenterology
While for all other specialties the share of treatments delivered by the independent sector has held steady or increased, gastroenterology (Figure 4b) presents a different picture. Here, the independent sector’s share of treatments has shrunk, from an average of 20% in the pre-pandemic period, to 14% in the period since June 2021 (though this continues a trend that was evident prior to the start of the pandemic). This has taken place against a backdrop of an overall reduction in the total volume of gastroenterology treatments across the NHS and independent sector, not yet recovering to pre-pandemic levels.
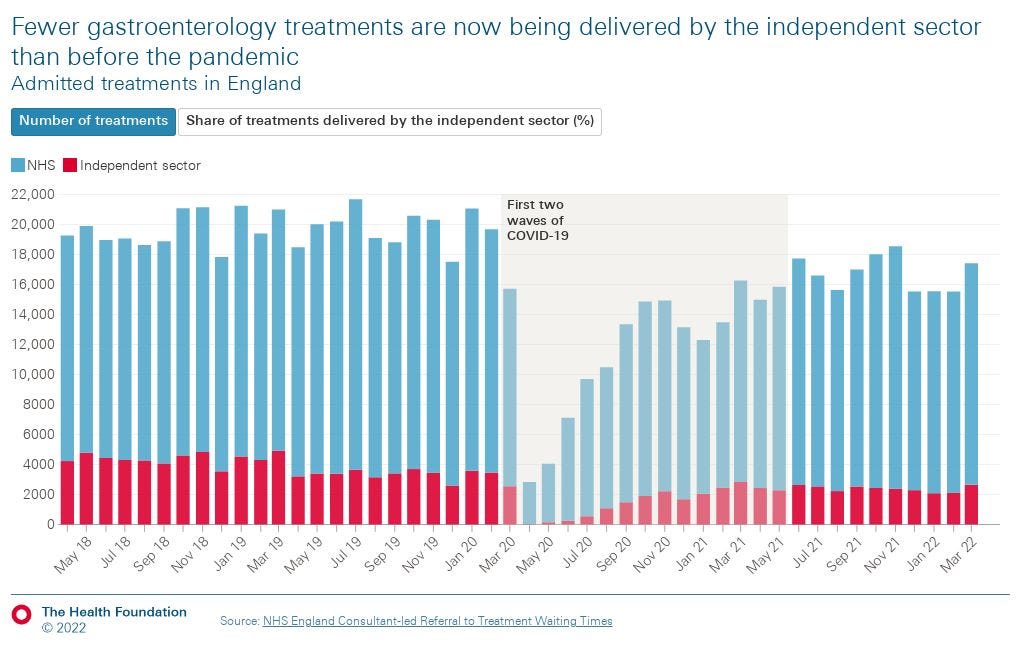
The reasons for this are unclear. However, it has been suggested to us both that some trusts are increasingly relying on private providers for routine procedures such as endoscopies, and also that there is a move away from endoscopies (which the independent sector has been well-established in providing) and towards novel diagnostic tools which the NHS is providing (such as faecal immunochemical tests, cytosponges and capsule cameras). This may explain some of the changes we have observed.
Trauma and orthopaedics
After ophthalmology, the specialty with the highest average monthly volume of treatments started is trauma and orthopaedics (Figure 4c). During the pandemic, there was a marked decrease in the number of such treatments — which include knee and hip joint replacements. As of the end of March, this specialty had the highest number of patients waiting to start treatment — more than 730,000 patients.
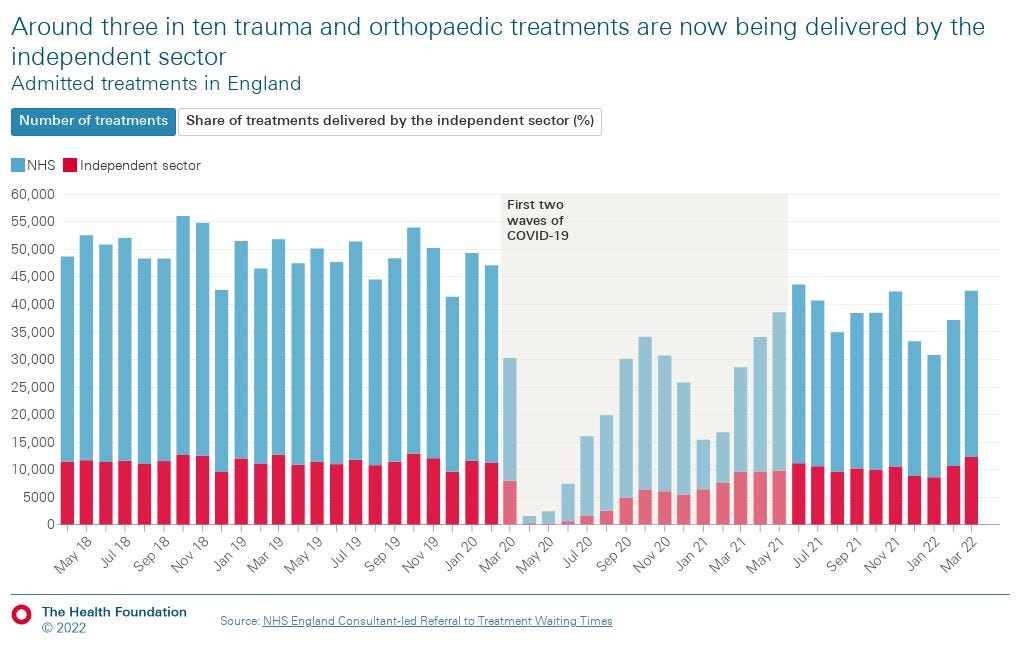
While the share of trauma and orthopaedic care being provided by the independent sector had been very stable in the pre-pandemic period, there has been a slight increase since mid-2021. The increase in share is, however, driven not by an increase in the volume of treatments the independent sector has been delivering, but rather by the independent sector volume recovering closer to pre-pandemic levels than the NHS. This could be due to NHS providers having to care for emergency patients, for example those seriously unwell with COVID-19, while the independent sector largely avoids this pressure.
Changes in the distribution of care between the NHS and the independent sector may affect access to care, quality of care, or patient outcomes. While assessing this goes beyond the scope of this analysis, in the following section we briefly explore variation by region and deprivation and begin to consider what this might mean for health inequalities.
How does independent sector delivery vary by region and level of deprivation?
There are important equity dimensions to any consideration of the role of the independent sector in delivering NHS-funded elective care. As we illustrated earlier, independent sector providers are not distributed evenly around the country, nor do they currently contribute equally to all specialties.
We also know from previous Health Foundation analysis that the backlog of patients waiting for elective care is not evenly distributed. Patients living in more deprived areas have experienced more disruption to their diagnosis and treatment. In this context, it is important to understand whether patients waiting for care may be more or less likely to have their treatment delivered by an independent sector provider depending on where they live.
In the following charts we explore whether and how the proportion of admitted care delivered by the NHS and the independent sector in the 2021/22 financial year differs by region and by level of deprivation (measured using the index of multiple deprivation; IMD).
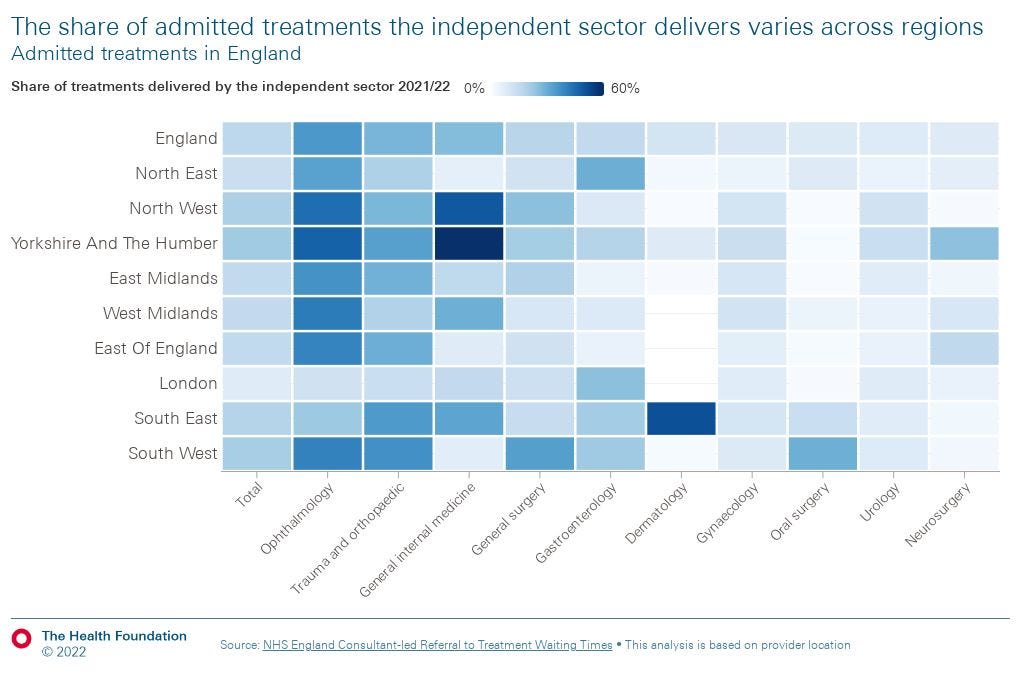
We found some regional variation in the proportion of admitted treatments the independent sector delivers. In 2021/22, we found that of all elective care delivered by providers located in London only 7% of this was delivered by independent sector providers. This compares to 19% in the North West, 20% in the South West, and 21% in Yorkshire and the Humber, which had the highest proportion.
We found that this was partly driven by differences between regions in how much care the independent sector delivers in certain specialties. For example, for admitted care delivered by providers located in London, the proportion delivered by the independent sector in ophthalmology (11%) has not reached the levels it has elsewhere (over 40% in the North West and Yorkshire and the Humber). In the South East of England, independent sector providers carried out half of all admitted dermatology procedures delivered by providers in the region, whereas in other regions, this share did not surpass 10%.
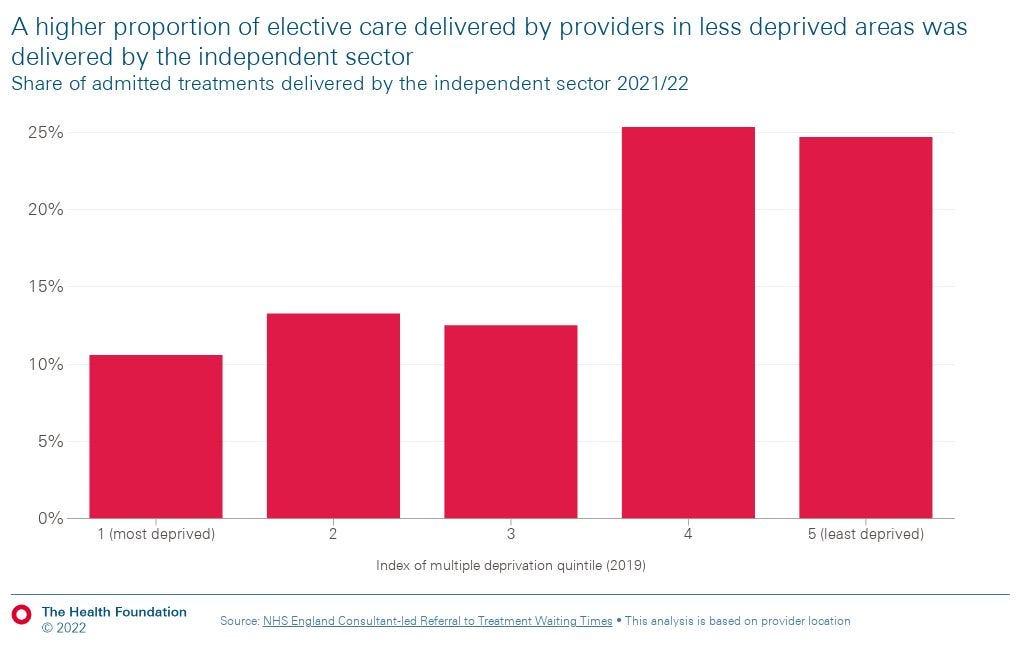
We also found that a higher proportion of elective care delivered by providers located in less deprived areas was delivered by the independent sector. This difference is especially pronounced for admitted care: 25% of elective care delivered by providers in England’s least deprived quintile was delivered by the independent sector, compared with 11% in the most deprived quintile.
The implications of this for health inequalities are unclear — especially as this analysis is based on the location of the providers, rather than the patients — but one possible concern would be that if use of the independent sector does help to reduce, or even maintain waiting times, then patients in more deprived areas could find themselves comparatively disadvantaged.
Conclusion
Our analysis raises several important questions about the role of the independent sector in delivering NHS-funded elective care that warrant further attention.
First, it suggests that overall activity levels, especially for admitted treatments, have yet to reach the numbers required to enable the NHS to tackle the waiting list, which continues to grow.
The independent sector, however, is responsible for a higher proportion of admitted treatments than pre-pandemic.
This requires further scrutiny.
- Could the increased proportion of treatments being delivered by the independent sector be helping to limit waiting list growth, by delivering care that otherwise couldn’t be delivered by the NHS?
- Or does this represent displacement of activity from the NHS to the independent sector?
In the context of value-for-money concerns about the use of the independent sector raised by NHS England, and the ongoing disruption to elective care being caused by COVID-19, this is important.
Second, NHS England has been clear in its expectations that elective care recovery should be inclusive, tasking integrated care systems with providing detail for how their plans will ‘ensure inclusive recovery and reduce health inequalities where they are identified’.
This analysis does not provide definitive evidence as to the inclusiveness of elective care recovery.
But the variation we have observed — for example, the differing proportions of treatments delivered by independent sector providers in areas with different levels of deprivation — does highlight the need for further investigation and oversight to understand the reasons behind such variation, and the possible implications for efforts to deliver an inclusive recovery.
Originally published at https://www.health.org.uk.

