


Measuring Financial Protection in Health in Brazil: Catastrophic and Poverty Impacts of Health Care Payments Using the Latest National Household Consumption Survey
HEALTH SYSTEMS & REFORM2021, VOL. 7, NO. 2
Edson Correia Araujo and Bernardo Dantas Pereira Coelho
Health, Nutrition and Population Global Practice,
The World Bank, Washington, DC, USA
imagecredit: whoeurope
Abstract
Objective
This paper measures financial protection in health in Brazil by estimating the incidence and describes the profile of catastrophic expenditures and impoverishment due to household out-of-pocket (OOP) health spending.
Methods
It uses the latest Brazilian consumption survey (POF 2017/2018) to analyze the composition of household health spending and applies two thresholds of household consumption to identify households facing catastrophic expenditures and impoverishment due to health care payments.
Results
- Results show that a third of households spend more than 10% of their budget on health,
- and the share of households facing financial hardship is significantly higher among the Brazilian poor (37% among the bottom consumption deciles).
- Medicines are the main contributor to component of OOP health spending, reaching 85% of all OOP payments for the lowest consumption deciles.
- Households with women as household head and those with heads with more years of schooling have higher probability of incurring catastrophic health spending.
- Yearly, more than 10 million Brazilians are pushed into poverty due to OOP health care payments, which represents a larger percentage of individuals (4.87%) than reported globally (2.5%) or among Latin America and Caribbean countries (1.8%).
Conclusions:
Despite the achievements in implementing universal health coverage in Brazil, challenges remain to guarantee financial protection to its population (especially the Brazilian poor).
Policies to expand access and affordability of essential medicines are key to improve financial protection in health in Brazil.
FULL VERSION
Introduction
Brazil was one of the first low- and middle-income countries (LMIC) to establish universal health coverage (UHC) with the creation of the Unified Health System ( Sistema Unico de Saúde or SUS) in the late 1980s.
The SUS, often referred to as the biggest public health care system in the world, covers virtually 100% of the Brazilian population (220 million people) and has over 50,000 treatment centers.
It is funded through general taxes and offers universal access to health care to the entire Brazilian population without cost at the point of delivery.
The creation of SUS has been associated with remarkable expansion of the public health service delivery system, improvements in access, and health outcomes.
- Between 1998 and 2019, the primary health care (PHC) teams increased from 4,000 to over 43,000 and enrollment in PHC surpassed 84 million people (from 10.6 million in the 1998).1
- Access to health services increased sharply, with the number of individuals seeking PHC services increasing by about 85% between 1998 and 2013.2,3
Despite the achievements, there are large gaps in the access to quality health services across socio-economic groups.
- The SUS, main source of care to two-thirds of the population, is often seeing as overcrowded, with long waiting times for specialized and elective services, while private sector providers offer services on demand often of higher perceived quality.
- Moreover, the cost of medication is a burden for poorer individuals, despite the support of programs such as the Farmácia Popular, which subsidizes the cost.4
- The differentials in access and quality of care push many households to incur out-of-pockets payments (OOP) or to purchase private voluntary health insurance (VHI), creating a segmented two-tier health system.
- Those who access care through OOP and/or VHI report easier access to preventive services and better quality of care then those relying solely on the SUS.5,6
As a result of the quality inequalities, health care financing in Brazil relies significantly on the private sector, both through PHI and OOP payments.
Total health expenditures (THE) in Brazil, estimated at 9.3% of the country gross domestic product (GDP) in 2017, is comparable to the average of countries within the OECD (8.8% of GDP),
- however, unlike most OECD countries, the private sector accounts for more than half of THE: representing 5.4% of GDP in 2017,
- while public spending accounted for 3.9% of GDP.7
- Household OOP payments for drugs were estimated at approximately 1.5% of GDP in 2017, or 30% of all households’ health spending.7
The expansion of the access to quality services remains a key challenge of the SUS.
The current Covid-19 pandemic shed light on several fragilities of the system, in particular the social and regional inequalities that are translated in the differences in mortality ratios.8
This paper focuses on how the system fragilities affect the financial protection of the population.
Financial protection means that everyone can have access to needed health services without incurring financial hardship.
Because OOP is subject to household’s ability to pay, without any type of risk pooling mechanism to protect households, it often results in socio-economic inequalities in the access to health services.9
Additionally, OOP may affect a household’s well-being by reducing the amount of household resources available to fulfill basic needs, such as food and shelter.
Catastrophic OOP health expenditure reduces non-health expenditure to a level where a household is unable to maintain consumption of necessities.
The effects of OOP payments on household well-being are measured by two main dimensions:
- catastrophic expenditures and
- impoverishment.
Catastrophic expenditure is defined by setting a threshold of proportional OOP spending of the household budget on health (which excludes VIH payments)a, if a household spends above that threshold it is said to face catastrophic health expenditure. Impoverishment due to health care spending measures the extent to which people are made poor, or poorer, after incurring health spending (which can be catastrophic or not).10
The latest global evidence shows that in 2015 nearly 927 million people faced catastrophic health expenditure and more than 180 million were pushed into poverty due to spending on health care.9
Catastrophic spending, measured as spending on OOP health exceeding 10% of household consumption, increased by 2.4% a year between 2010 and 2015 (from 9.4% of the population facing catastrophic expenditures in 2000 to 12.7% in 2015).
The WHO and the World Bank estimate that in 2015 OOP payments for health pushed approximately 99 million people into poverty (below $3.20 USD poverty line) and almost 90 million into extreme poverty (below $1.90 USD poverty line).9
Using the 2008 household expenditure survey, the report estimates at 25.6% the percentage of Brazilian households facing catastrophic health expenditure at 10% threshold (and 3.5% of households at a 25% threshold), and an increase in poverty of 1.98% of the population and extreme poverty of 1.04% of population ($1.90 and $3.20 USD poverty lines, respectively).
Globally, the main contributor to these outcomes are medicines and outpatient care.9,b
Previous evidence in Brazil shows a wide range of estimates of catastrophic OOP health expenditure (from 0.7% to 21.0%) but these used different methodologies, including surveys with smaller sample (Luiza et al.4 ), or sample that is specific to households with older individuals,11 or older databases.12,13
This paper uses the latest Brazilian Consumer Expenditure Survey ( Pesquisa de Orçamento Familiar or POF), released in 2020 with data from 2017/2018, to analyze the composition of household spending on health care and the effects of OOP on financial protection within the Brazilian health system.
Materials and Methods
POF is a nationally representative household survey which contains detailed household consumption data, household income and socio-economic variables of household members. The survey includes disaggregated consumption data for 69,660 households on a wide range of health-related products and services, which allows to identify expenses on private health insurance, medicines, physicians’ fees, exams, and other medical expenses. POF has been widely used in Brazil to estimate household well-being and poverty.14–17Catastrophic Health Expenditures
This paper follows the definition of catastrophic health expenditure according to the SDG 3.8.2 and used by the World Health Organization (WHO) and the World Bank in the Global Monitoring Report on Financial Protection in Health 2019.9 Catastrophic health expenditure is defined as OOP spending on health that exceeds 10% or 25% of total household consumption.9,10 The rationale to apply two different thresholds is due to the fact that a single threshold may not capture spending that are just above a given percentage and that poorer households may have higher constraints into their ability-to-pay for health care as poorer households dedicate a higher share of their spending on food items; this approach increases the difference between bottom and top income groups.
In addition to estimate the incidence of catastrophic health expenditure, this paper explores the determinants of catastrophic health expenditures across households. The objective is to identify households socio-economic and demographic characteristics associated with higher probability of incurring catastrophic health expenditures. The probability of a household to incur catastrophic health expenditure, using 10% and 25% thresholds, is modeled as follows
Where


Where hi is the binary variable that indicates whether household incurred catastrophic expenditures, xi is a vector of various explanatory variables, and β is a vector of parameters covering household characteristics (economic, demographic) and a set of geographical variables.
Economic variables are: the natural log of the household income per capita and the natural log of consumption per capitac. Demographic characteristics include: characteristics of the head of the household, such as the number of years of schooling, gender and race; size of the household; the number of children under 5 years old; and the number of elderly (those above 65 years). Geographical variables include whether it is an urban or rural household, and dummy variables for each Brazilian state.
Impoverishment Due to OOP Health Spending
We estimate impoverishment due to OOP health expenses using the relative poverty methodology, described in the Global Monitoring Report on Financial Protection in Health 2019.9 Using household data from POF, a household is defined as relatively poor if its consumption is below 60% of the median. Impoverishing out-of-pocket spending on health occurs when a household diverts nonmedical consumption in items such as food, shelter, and clothing to such an extent that its spending on these items is reduced below the level indicated by the poverty line. Relative poverty line is defined in two different ways, using 60% of the national median consumption and 60% of the state median consumption.
Results
Health Spending within Household Budget
On average, health expenditures accounts for 13% of household consumption varying across household income deciles. Among the lowest consumption decile, average health expenditure accounts for 12.1% of their consumption, while among the richest it accounts to 14% ( Figure 1). In comparison with other consumption groups, health expenditure is the fourth largest expenditure item, after habitation (36.6%), transportation (18.1%), and food (17.5%). The consumption pattern across income deciles changes when VHI premiums are excluded from household consumption, average health expenditures drop to 10.5% with the lowest consumption decile spending on average 11.6% and the top consumption decile spends on average 7.7%. This indicates that the composition of health expenditures among richer households are more likely to protect these households from incurring catastrophic health spending.
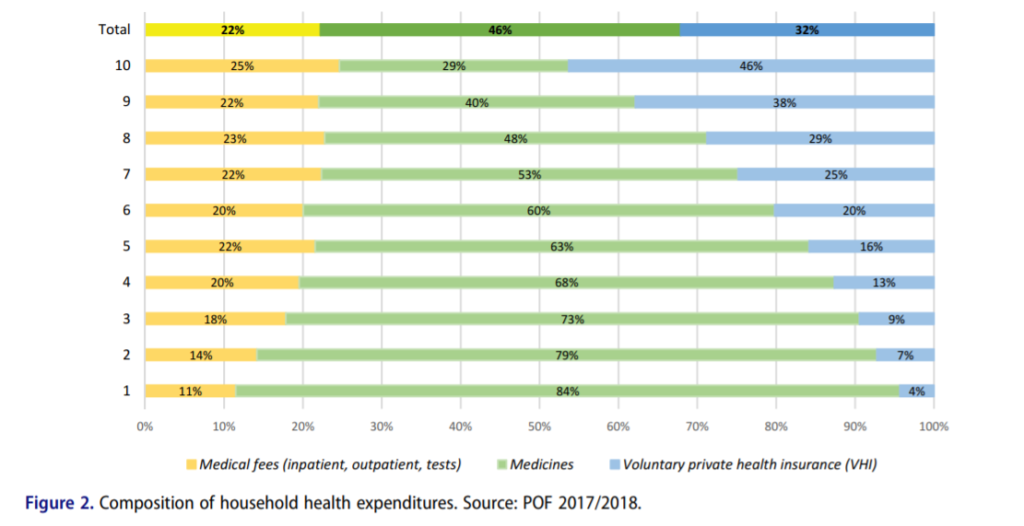
VHI premiums account for 32% of all household health expenditure and as expected it is highly progressive, as depicted in Figure 2. Those at the bottom of consumption distribution spend on average 4% of the household health expenditure on VHI while the percentage increases across all consumption deciles to reach 46% among those at the top deciles. In terms of financial protection these payments are not as problematic, since VHI represents a risk pooling mechanism, which is likely to protect households against catastrophic expenditures.18 OOP payments for medicines and medical fees account for 68% of all household’s health care payments and an average of 8.4% of all household consumption. The burden of these payments lies proportionally more on poorer households, the lowest consumption decile spends on average 10.6% of their household consumption on medicines and medical fees, while among the highest consumption decile the average is 6.8%. The purchase of medicines is the main component of households’ health spending; it accounts for approximately 46% of all household health (67% of all OOP payments, when excluding VHI). Among those at the bottom of the consumption distribution, purchase of medicines accounts for 84% of household health spending, which is approximately three times higher than the average among those in the highest income decile (29%). The purchase of medicines heavily affects the poorer households, the average spending across the first seven consumption deciles is steadily over 50% of the total household health spending ( Figure 2). Payment for medical fees (inpatient and outpatient care services) accounts for an average of 22% of the total households’ health spending, varying from 11% among the bottom consumption decile and 25% for the highest consumption decile.
Catastrophic OOP Health Spending
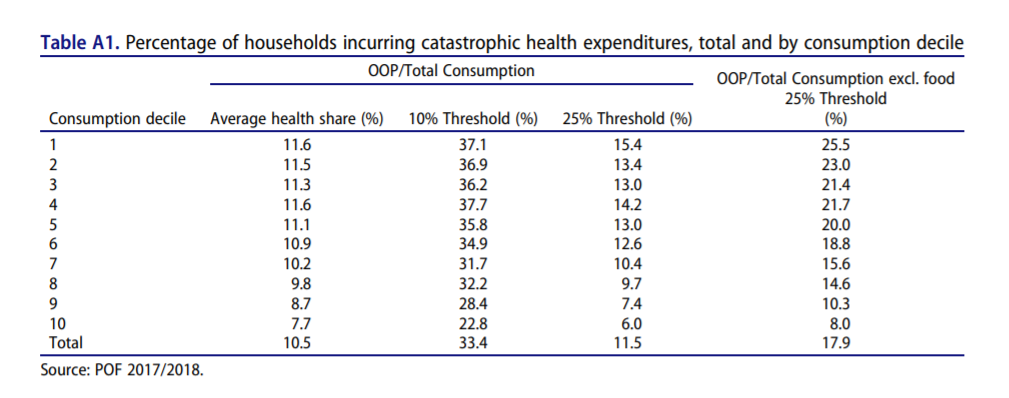
Catastrophic health expenditures are largely concentrated amongst the poorer households. Table A1 presents the average household OOP by consumption decile and the percentage of households incurring catastrophic health spending measured by the 10% and 25% thresholds. Applying the 10% (of total household consumption) threshold 33.4% of the Brazilian’s households incur catastrophic health expenditures. Furthermore, catastrophic health expenditures are significantly higher among poorer households, with over 37% of the households at the lowest consumption decile facing catastrophic health expenditures compared to approximately 8% of the households at the highest consumption decile. Using the 25% threshold the incidence of catastrophic health expenditures drops significantly, to 11/5% of all households. Among the poorer households, first consumption decile, the incidence of catastrophic health spending is 15.4% and decreases across consumption distribution (just below 10% for the 8th decile and 7.4% and 6% for the 9th and 10th deciles, respectively). Using the 25% threshold and considering households’ ability pay, by excluding food expenditures, approximately 18% of all households incur catastrophic health expenditures. Excluding food expenditures (using the 25% threshold) increases considerably the incidence of catastrophic health expenditures, particularly among the poorer households, increasing more than 10 percentage points when considered at 25% threshold (from 15.4% to 25.5%). The incidence of these payments remain highly concentrated amongst the poorer households (25.5% of the households at the bottom consumption decile compared to 8% among the richer consumption decile).
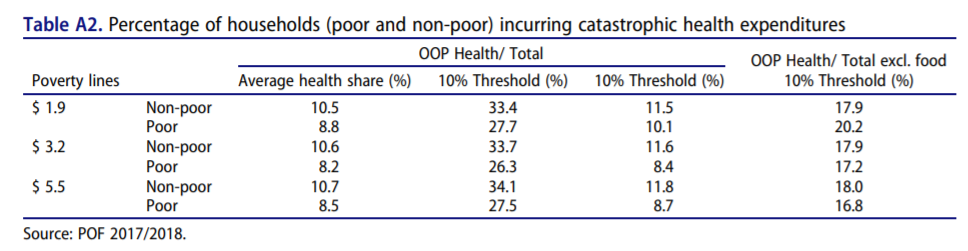
Table A2 presents the incidence of catastrophic health expenditures among the poor and non-poor Brazilian households, using poverty lines defined by the World Bankd. Using the 10% threshold, 27.7% of the extreme poor households (income per capita below the $1.90 USD a day) face catastrophic health expenditures in Brazil. Across all defined poverty lines ($1.90, $3.20, and $5.50 USD, PPP adjusted), the non-poor householdse have consistently larger share of households incurring catastrophic health care payments. This highlights the importance of looking at the effects of these payments on poverty estimates, as some households may become poor (or extreme poor) after incurring these catastrophic payments (resulting in changes in the overall poverty estimates).
The incidence of catastrophic health spending varies considerably across Brazilian states. Table A3 contains the percentage of households incurring catastrophic health spending across Brazilian states using both 10% and 25% thresholds. These percentages were calculated using the budget share approach, which does not exclude food from total expenditure. Applying the 10% threshold, the incidence of catastrophic health spending varies from 20.4% in Amapá to 39.6% in Espirito Santo. Applying the 25% threshold, Espirito Santo and Amapa states remain with the largest percentage of households incurring catastrophic spending (16.3%) and the lowest (3.2%), respectively. There is no clear pattern for the distribution of catastrophic health spending across states; both extremes of the distribution have richer states, such as Minas Gerais (38.9%) and Federal District (28.7%), and poorer states, such as Alagoas (36.4%) and Maranhão (33.4%).
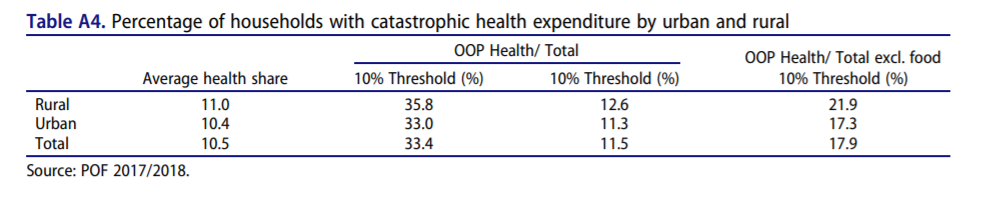
Households in rural areas present higher levels of catastrophic health spending. On average, rural households spend 11% of their total budget on health care while urban households spend slightly lower percentage (10.5%) (Table A4). Approximately 36% of rural households incur catastrophic health spending compared to 33% among the urban households. When applying the 25% threshold the difference between urban and rural households is smaller, with 12.6% of rural households and 11.3% of urban households facing catastrophic health spending. Excluding food consumption from the analysis increases the difference, which is expected as rural households are, on average, poorer. The incidence of catastrophic health spending among rural households (21.9%) is 4.6% higher than among urban households (17.3%) using the 25% threshold.
Regression Analysis Results: Determinants of Catastrophic Health Spending
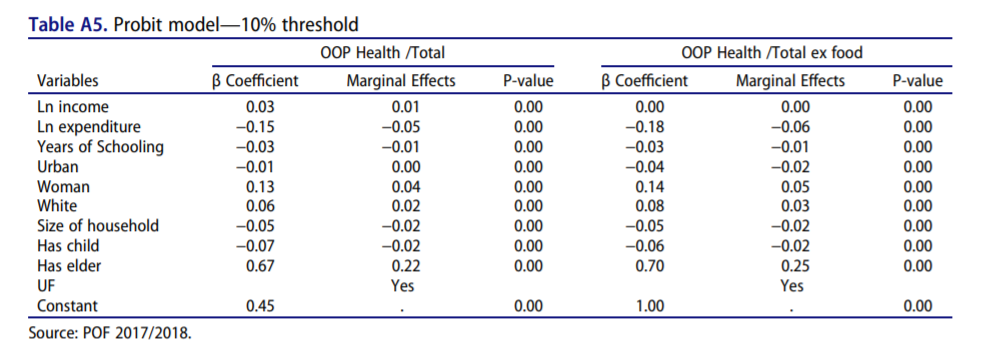
A Probit model is used to identify how socioeconomic characteristics influence the incidence of catastrophic health spending. The model estimates the probability of a household to incur catastrophic health spending using the 10% and 25% thresholds, as shown in Tables A5 and A6, respectively. Both tables present the estimated β-coefficient of the Probit model, the average marginal effect of the variable and the p-value of the estimate.
The results suggests a correlation between an increase in the household per capita expenditure and, ceteris paribus, the probability of the household to incur catastrophic health spending, using both the 10% and 25% thresholds ( budget share approach). In the model that includes food items in total consumption, a 1% increase in the per capita expenditure is expected to reduce the probability of a household to spend more than 10% of its total budget on health by 5 percentage points and reduces the probability of spending more than 25% by 3 percentage points. The effect of the (natural logarithm of) household income per capita is different when we estimate the impact on the probability of spending more than 10% or 25% of the budget in health items. While an increase of 1% in the income is expected to increase by 1 percentage point the probability of catastrophic health spending when the 10% threshold is used, it reduces the probability of spending more than 25% by the same amount, 1 percentage point.
Having a woman as household head increased by 4 percentage points the probability of a household incurring catastrophic health spending using the 10% threshold, and by 2 percentage points using the 25% threshold. Households where the head is white also have 2 percentage points higher probability of spending more than 10% of their budget on health care and 1 percentage point of spending more than 25%. Each additional year of schooling of the household head reduces by 1 percentage point the probability of a household catastrophic health spending, using both 10% and 25% thresholds as reference. Contrary to the argument presented by O’Donnell et al.,19 the results show a negative correlation between the size of the household and the probability of incurring catastrophic health spending, with larger households having a smaller probability of catastrophic health spending. An extra individual within the household reduces, on average, by 2 percentage points the probability of incurring in catastrophic health spending using the two thresholds (10% or 25% of the household budget). Presence of children under five years old in the household also reduces the probability of catastrophic health spending by 2 percentage points for the 10% threshold and by 1 percentage point for the 25%.
The variable with the highest correlation, by a large margin, is the presence of elderly individuals. Households in which at least one individual has at least 65 years have 22 percentage points higher probability to spend at least 10% of their budget in health, when compared to households without elder individuals. For the 25% threshold, the increase in probability is smaller, at 11 percentage points, but still much larger than any other effect. This result is not unexpected, as elderly individuals in general demand more health care services, but the large margin indicates the importance of assuring access to services as well as financial protection for this population group.
Finally, urban household have a similar probability of incurring catastrophic health spending when considering the 10% threshold. When considering the 25% threshold, urban households have 1 percentage point higher probability to incur catastrophic health spending than rural households.
Impoverishment Due to OOP Health Spending
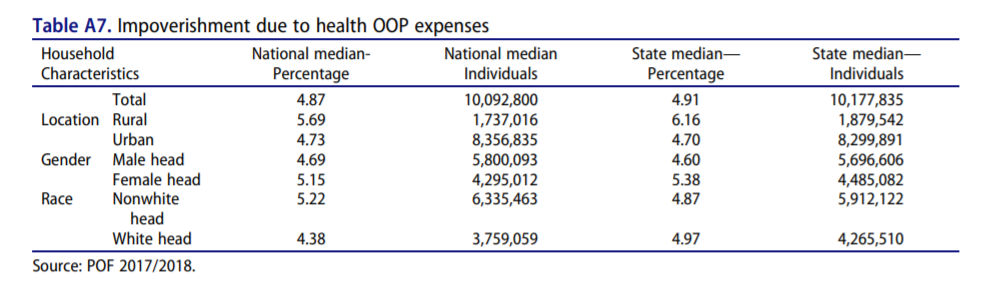
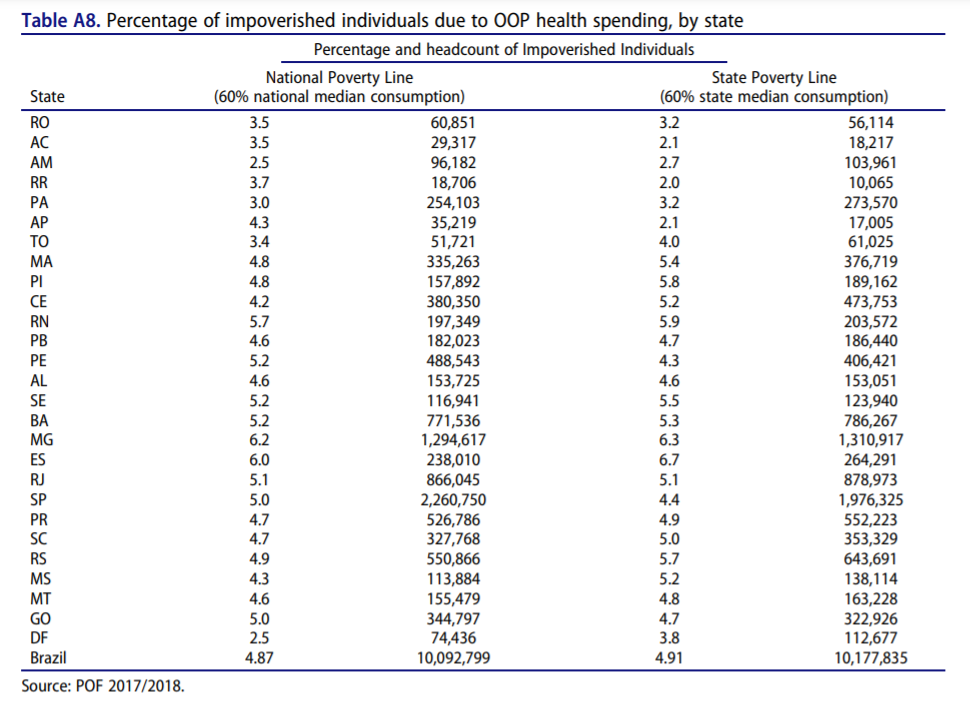
Applying the 60% of the national median consumption, impoverishment is estimated at approximately 4.87%. In other words, approximately 10 million Brazilians live in households in which health care payments reduce the household’s consumption per capita to a level below 60% of the national median. That percentage is relatively stable across different households, with higher percentage across rural households (5.69% or 1.7 million) and households with nonwhite heads (5.22% or 6.3 million) ( Table A7). Applying the state specific poverty line (60% of the state medium consumption) does not change significantly the results, with a slightly higher percentage of households impoverished due to health care payments (4.91%) with rural households also having more impacts (6.16%), followed by households with female heads (5.38%). Table A8 presents the results of the analysis nationally and for all Brazilian states.
Discussion
Brazilian households allocate, on average, 13% of their household consumption to health care. Although this share is marginally larger among richer households (14% of the household consumption for those at the top consumption decile), it reverts when excluding VHI payments (which is mostly concentrated among the richer). Purchase of medicines accounts for 46% all health care payments and 67% of all OOP payments for health and is particularly high among the Brazilian poor (reaching 84% of all health care payments for the lowest consumption decile). As a results, health care payments among poorer households in Brazil are mostly OOP payments and, consistent with the global evidence, these payments result in financial hardship for them-approximately 28% of the extreme poor households face catastrophic health care payments. Overall, over a third of Brazilian households spend more than 10% of their budget on health, i.e., incurring catastrophic health spending. Catastrophic health spending is regressive, with poorer households (those at the bottom deciles of consumption distribution) bearing proportionally more the burden of these payments. In comparison with other countries Brazil presents a much higher incidence of catastrophic health expenditure. The Global Monitoring Report shows a global average incidence of 12.7% using the 10% threshold and 2.9% using the 25% one. Latin America has a higher average for the 10% threshold, with 15.1% incidence in 2015, the latest data, a decrease of 3.5% in comparison with data from 2010.
The analysis shows population groups that are most likely to face financial hardship due to health care payments. The richer the household, the less likely it will incur catastrophic health spending. Households with a woman as household head and those with heads with more years of schooling have higher probability of incurring catastrophic health spending. Contrary to the argument presented by O’Donnell et al.,19 larger households have lower probability of facing financial hardship due to OOP health care payments. Having elderly in the household is a major determinant for incurring catastrophic health spending, which may be linked to higher payments for medicines.
The results suggest an upward trend in the incidence of catastrophic health spending when compared to previous reports for Brazil. Boing et al.,20 using the 10% threshold, showed an increase in the incidence of catastrophic health spending from 21.1% in 2002/2003 to 25% in 2008/2009 (using PF data for both periods). Similarly, the Global Monitoring Report on Financial Protection in Health 2019, using 2008 POF data, estimated at 25.6% and 3.5% of households facing catastrophic health spending at the 10% and 25% thresholds, respectively. Using a different database, the 1996 Living standards measurement studies, Xu et al.21 estimated that 10.27% of households in Brazil had catastrophic health expenditure levels, using a threshold of 40%. However, this study had a much smaller sample, with only 4,850 observations. Bernardes et al.11 use a different database, the Estudo Longitudinal de Saúde dos Idosos Brasileiros (ELSI-Brasil) of 2015–2016, a survey with a sample of 9,412 individuals living in households that have at least one individual over the age of 50. They estimate that 17.9% of the households spend over 10% of their budget in health expenses, while 7.5% spend over 25%.
A similar upward trend is observed in terms of percentage of households pushed into poverty due to health care payments, 2.62% according to the Global Monitoring Report and 4.87% (or 10 million Brazilians)f. Kawabata et al.22 discuss the potential impoverishment of health expenditure, and in particular how despite a country adopting universal coverage policy, catastrophic health expenditure may continue leading to impoverishment if the benefit package of social security is too small.
Brazil is performing worse in terms of financial protection in health than the global average and among the Latin America and Caribbean (LAC) countries. The latest evidence points to a global average of 12.7% of households facing catastrophic health spending, and among LAC countries this share reaches 15.1% (using a 10% threshold). Likewise, globally 2.5% of the population is pushed into poverty due health care payments (1.8% of LAC households), which represents 183.2 million people globally (11.5 million of them in the LAC region)-2015 estimates using 60% of median daily per capita household consumption.
In terms of policy, our results suggest that Universal Health Coverage does guarantee that poor households are safe from having catastrophic health expenditure, as expenditure for medication alone is sufficient for poor households to compromise a large percentage of its budget. This conclusion goes in line with Luiza et al.4 in which medication expenditure was responsible for 60% of the households identified as having catastrophic expenditure.
Conclusion
This article presents new evidence on financial protection in health in Brazil. It shows that despite the achievements over the last 30 years, the Brazilian health system still faces challenges to guarantee financial protection to all Brazilians, particularly the poor. This is particularly important given the fact Brazil has a universal health system which provides services entirely free at point of use for all Brazilians. Moreover, the trend in catastrophic health spending and impoverishment due OOP health care payments is upward over the same period that the SUS has been consolidated as the main option to access health services among the Brazilian poor. Although quality differentials and timeliness to access health services differ widely (across public and private sectors) in the two-tier Brazilian health system, these do not explain the financial hardship faced by households (particularly the poor). Consistent with the global evidence, medicines are the main component of OOP spending on health in Brazil and, consequently, a main determinant for whether a household faces financial hardship (incurring catastrophic health spending or pushed into poverty due OOP health care spending). This article presents new evidence on financial protection in Brazil. In addition to contributions to the debate on SUS financing, the analysis contributes to the global debate on UHC as Brazil has one of the largest public health systems in the world, SUS, and was one of the first low- and middle-income countries (LMIC) to achieve UHC.
Disclosure of Potential Conflicts of Interest
No potential conflicts of interest were disclosed.
Notes
See the original publication.
APPENDIX


References
See the original publication
Originally published at https://www.tandfonline.com.
ORIGINAL PUBLICATION
ORIGINAL PUBLICATION

To cite this article:
Edson Correia Araujo & Bernardo Dantas Pereira Coelho (2021) Measuring Financial Protection in Health in Brazil: Catastrophic and Poverty Impacts of Health Care Payments Using the Latest National Household Consumption Survey, Health Systems & Reform, 7:2, e1957537, DOI: 10.1080/23288604.2021.1957537
About the authors & Affiliations:
Edson Correia Araujo
Bernardo Dantas Pereira Coelho
Health, Nutrition and Population Global Practice, The World Bank, Washington, DC, USA